April 22, 2026

The Senior Project is an independent, student-led culmination of our high school experience. After three years of academic preparation, our seniors are ready to spend the last trimester of their high school careers applying the skills and knowledge they have gained to develop a project that is insightful, academically rigorous, and professional in nature. This year, we are proud to showcase a senior from one of our neighboring campuses, BASIS Independent Silicon Valley, Aarohi G.
Week 5: Seeing the Big Picture
By now, we’ve reached the end of my planned methodology for analyzing Same-Day and Automatic Voter Registration. And while these results contain some answers, they highlight important considerations and next steps that I’ll be investigating while moving forward with the variables I’m testing.
Visualizing Impact
When researching the best ways to graph the true effects of both SDVR and AVR, I found event study plots as the best visualization.
The y-axis represents the gap in voter turnout between treated states (those with the legislation) and control states (those that never implemented it). If the legislation had an effect, the gap would increase, but whether that was in a positive or negative direction depends, as we discussed in greater detail last week.
All states are organized so that their different enactment years align into one relative event time, the red line drawn to divide the graph into “before legislation” and “after legislation” periods.
The shaded area is the confidence interval, a visualization of how precise points are, with narrower areas corresponding to higher precision.
Key Characteristics
In that section before the red line, we’re looking for low fluctuation close to the x-axis, because the treatment and control states should be fairly similar at this point.
Ideally, CI should be narrower to indicate that the information is reliable and more certain. Also, if it crosses 0, the data isn’t statistically significant.
The line’s positive slope means an increase in turnout, so combined with a CI above 0, the legislation can be proven to increase turnout.
AVR
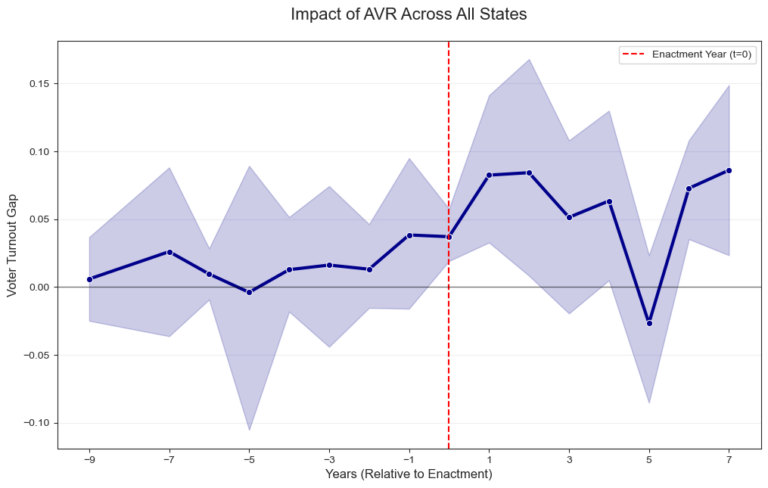
Overall, the flatter line pre-enactment shows that the control and treatment states fluctuated similarly. But the wide CI shows an uncertainty about the results, perhaps due to a wide variety of behaviors in each state. And after the enactment, in the first 2 years and the 7th, the CI is clearly above 0 and the upward slope shows increase in turnout post AVR. The drop approaching year 5 shows some decreasing turnout, but crossing 0 makes the causation uncertain, pointing to other factors affecting turnout.
SDVR
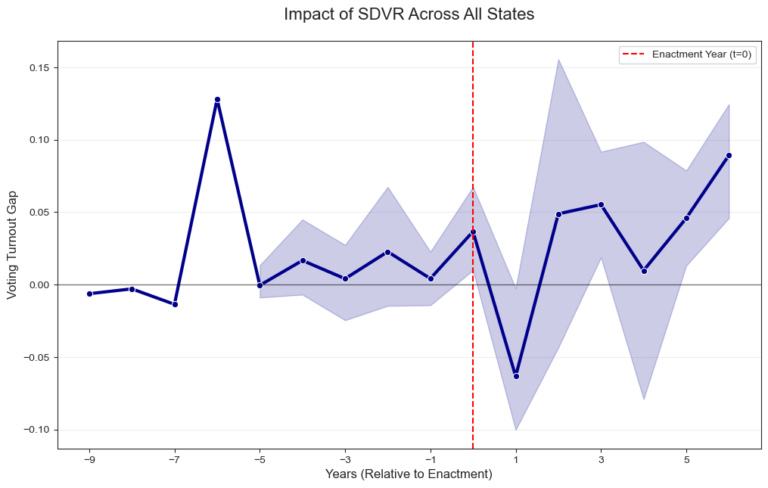
Again, the line is fairly straight with a narrow CI, a good indication of closeness before SDVR. But afterwards, the overlaps of CI where it touches and crosses 0 makes the result not statistically significant. At year 3 and 5 onwards, turnout increases more conclusively.
Takeaways
First, I may identify states that fluctuate in extreme ways and remove them to narrow the CI.
Second, I’ll try to factor out the states that have poor control state matches; as discussed last week, some states’ distance scores with their “closest match” are too large to really be considered a good control, which could be throwing off the results.
Overall, this points me in the direction of finding more years of turnout data. Working in the timeframe of 2014 to 2024 could be making it harder to find true close matches between states (by using distances derived in a short period), and displaying unreliable trends over just a few years. Finding this older data has proven challenging, but may be necessary.
Week 6: Campus Community
What I’ve learned so far is that, when it comes to the final act of voting at the polls, location is everything. A lack of accessibility or transportation costs can deter too many interested individuals. Young individuals often cite inconvenient location as a barrier to voting (CIRCLE, 2019). And as the Fair Elections Center points out, college campus polling sites are an opportunity to fix this, yet in 2020, 74% of campuses did not have any in-person voting options.
In Week 6, I worked to study how the availability of on-campus polling sites impacted voter turnout. As I began, I realized how different it was from the Same-Day and Automatic Voter Registration legislation I studied beforehand. First, the National Conference of State Legislatures was my primary source for SDVR and AVR data, with well-organized start times for legislation and descriptions of their nuances, whether they changed over the years, and more. Finding exact start years for on-campus poll sites was much harder, and the process drew from multiple sources. Second, instead of comparing whole states to each other, I’m comparing similar colleges (one treatment and one control).
Methodology
While researching, I found fewer real papers on this subject, but to help me narrow down my method, I read what factors make a college most similar to each other. These factors include their type (public, private, community college, etc.), tuition cost, highest degree awarded, and student-faculty ratio. For the most part, I was able to find this data from a source called College Scorecard. Next, I began grouping similar colleges by clustering them, a method based in the same principles of calculating each point’s distance to each other.
As of now, I’ve determined similar colleges in the states without AVR or SDVR at any time (to control for the effects of those legislation). However, adding the data for when each college began on-campus polling was more of a manual process I was only able to do for a few states, and instead of a clear start date, the source gave a two year range (ex. between 2025 and 2026). Now, I’m trying to find a better solution to the issue and be able to draw comparisons for more colleges in more states.
BASIS Independent Dublin is a Grades 6 – 12 private school, providing students with an internationally benchmarked liberal arts and sciences curriculum, with advanced STEM offerings. Considering joining the BASIS Independent Dublin community? To join our interest list for the next school year and receive admissions updates and more, please click here.