Week 10: Martian Mixology, Molecular Biology
June 4, 2024
Hiya! Happy Week 10, and welcome back to the blog!
Summary:
Here’s your recap: Following the arrival of our selected plasmids, we added a missing start codon in front of the MScarlet vector; the finished products (labeled Mscar-start) were stored to be entered into an E. coli test this week. Also, we started to germinate more seeds that will be colonized by the finished fluorescent Azospirillum, the goal is to show how our bacteria move (via the color of the fluorescent proteins) when interacting with the alfalfa underground. Finally, we shocked a culture of cells into the competent state, which will be thawed and combined with the finished transgenic plasmid at the end of the project.
Space Travel, Farm Expansion:
This week we focused largely on the remediation of our Martian soil groups. My previous literature review presented a captivating pathway to long-term survival, contrasting our current standing with only a few sprouts and their biomass (or lack thereof). According to the paper, when faced by sparse germination rates in Martian simulants, researchers were able to mitigate key issues like the dry texture and small particle size by introducing concentrations of Earth soil. Although you may be saying, “duh, plants grow in Earth soil,” I’d like to propose a line of thinking that occurred to me when confronting the issue of transporting terrestrial growth mediums to Mars as opposed to our original plan of only seeds, Azospirillum bacteria, and the materials to multiply it on arrival:
1: All plants create waste of some kind, even the most efficient, manicured sweet potato (a crop that continuously produces tubers) will drop leaves as the plant grows older. This fact allows for farm expansion if waste from their life cycles are repurposed into a soil-fixing supplement.
2: Given the opportunity to spread farmland as harvests are made, the initial amount of soil can be limited to a small area.
Sustaining one person on a vegetarian diet required approximately 0.32 acres of farmland; if we supplemented 25% of that volume with Earth soil, however, we’d have to carry 160,000 lbs of it on the ship with us (14x the weight of the spacecraft itself, and only for one passenger.) This is utterly impractical and we’d sooner just farm hydroponically; but if harvest waste is considered, the issue of transport becomes much more transparent.
The natural recycling process that occurs as plants shed layers opens the pathway to reduce that soil volume to as little as 54 lbs (although this is just a calculation, and would need to be simulated), as each crop produced will directly fuel the colonization of more Martian soil plots (Figure 1).
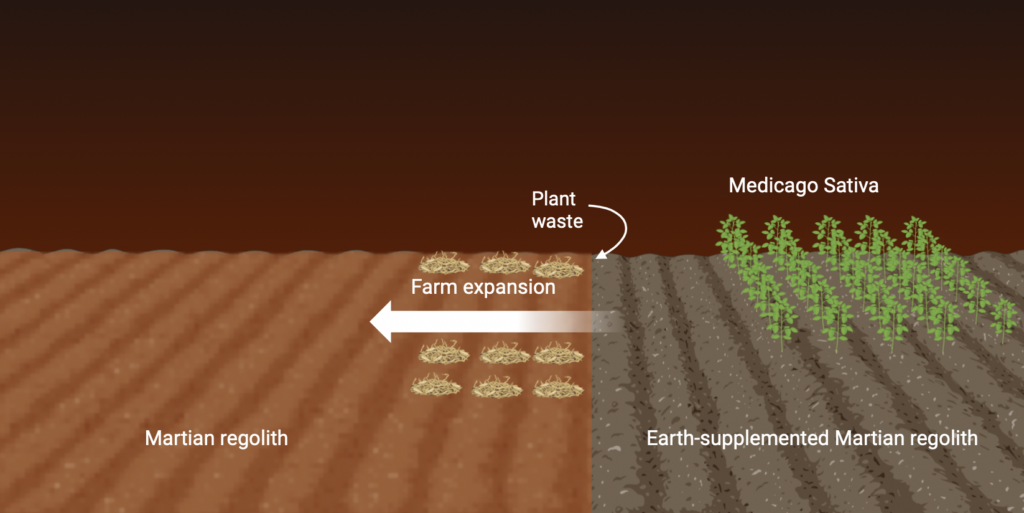
This plan is rather optimistic, but given that water is equally or more scarce as food during space travel, utilizing the life cycle of plants to our advantage proves itself as a necessary means for survival.
Considering this idea, for the purposes of thoroughly studying the viability of Azospirillum biofertilizer on Martian soil, I supplemented Earth soil with a concentration range of 0%, 50%, and 75% MGS-1. This alteration was fashioned due to the unforgiving dryness of 100% MGS-1 as noted in previous blogs, and will still allow us to study the effects of our bacteria on growing plants while (hopefully) exponentially stimulating their germination rates.
New Growth:
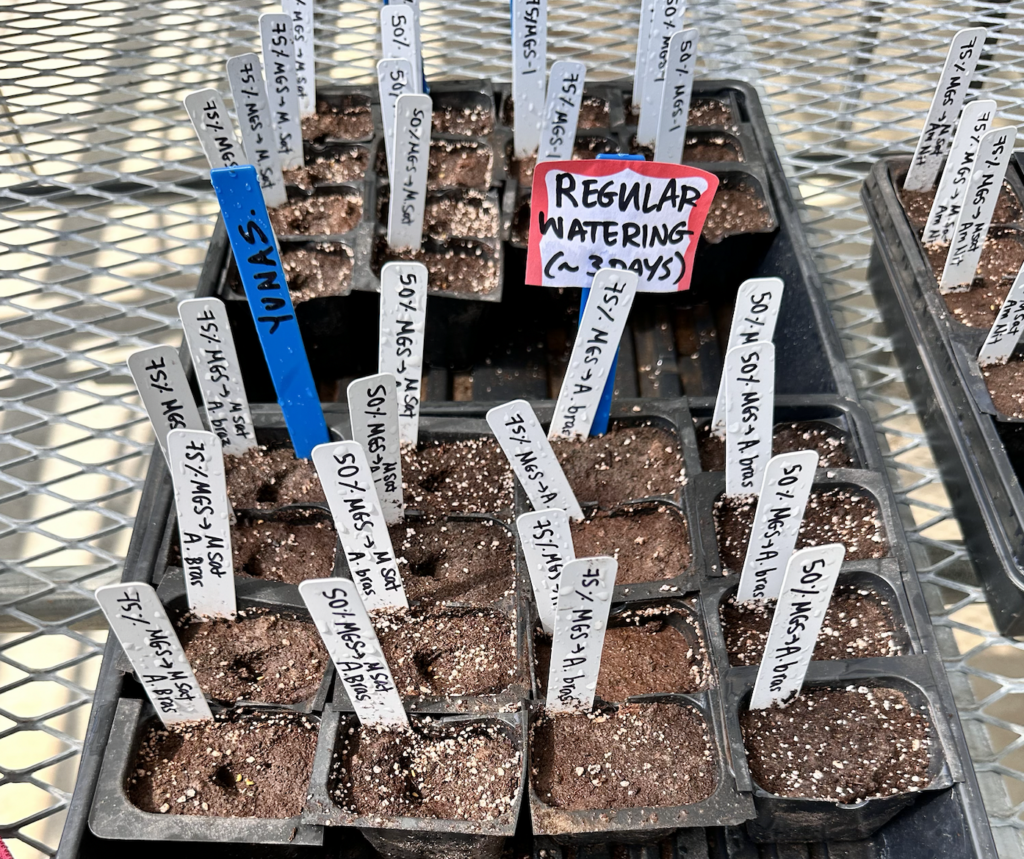
During the preparation of these new Earth-supplemented growth trays, I maintained the control groups that we previously outlined, expanding them to encompass the different combinations. They were as follows:
Group type Concentrations Treatment type, Purpose
Negative control: 0% MGS-1, 100% Earth–None, establish typical plant growth standard
Experimental: 0% MGS-1, 100% Earth–A. Brasilense, identify standard fertilizer effect
Negative control: 50% MGS-1, 50% Earth–None, establish baseline Martian plant growth
Positive control: 50% MGS-1, 50% Earth–Am. Nitrate, establish growth standard with successful Nitrogen implementation
Experimental: 50% MGS-1, 50% Earth–A. Brasilense, test biofertilizer on 50% MGS-1
Negative control: 75% MGS-1, 25% Earth–None, establish baseline Martian plant growth
Positive control: 75% MGS-1, 25% Earth–Am. Nitrate, establish growth standard with successful Nitrogen implementation
Experimental: 75% MGS-1, 25% Earth–A. Brasilense, test biofertilizer on 75% MGS-1
These groups are intentionally designed to analyze how Azospirillum compares to standard plant growth, and chemical alternatives.
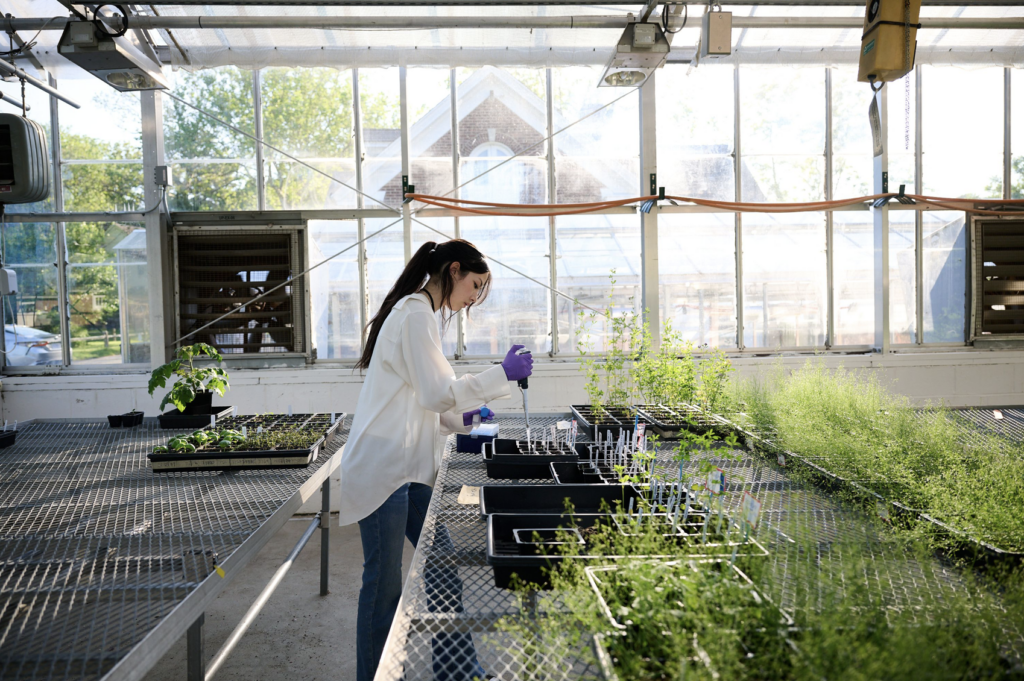
Each insert was prepared with the outlined volumes of each soil, and sowed with Medicago sativa (Figure 2). Greenhouse updates will return routinely next week as I check these tests!
Moving on, I’d like to draw your attention to the progression of our bacteria-Mscarlet protein engineered plasmids! As I mentioned last week, we ran a procedure to add the missing start codon component to the Mscarlet gene fragment. This week, E. coli were inoculated with that plasmid.
E. coli are an ideal candidate for testing for transformation success because they are extremely fast growing, while Azospirillum typically takes around three days based on our experience. So how do we verify that the ATG start codon was introduced and integrated into our bacteria?
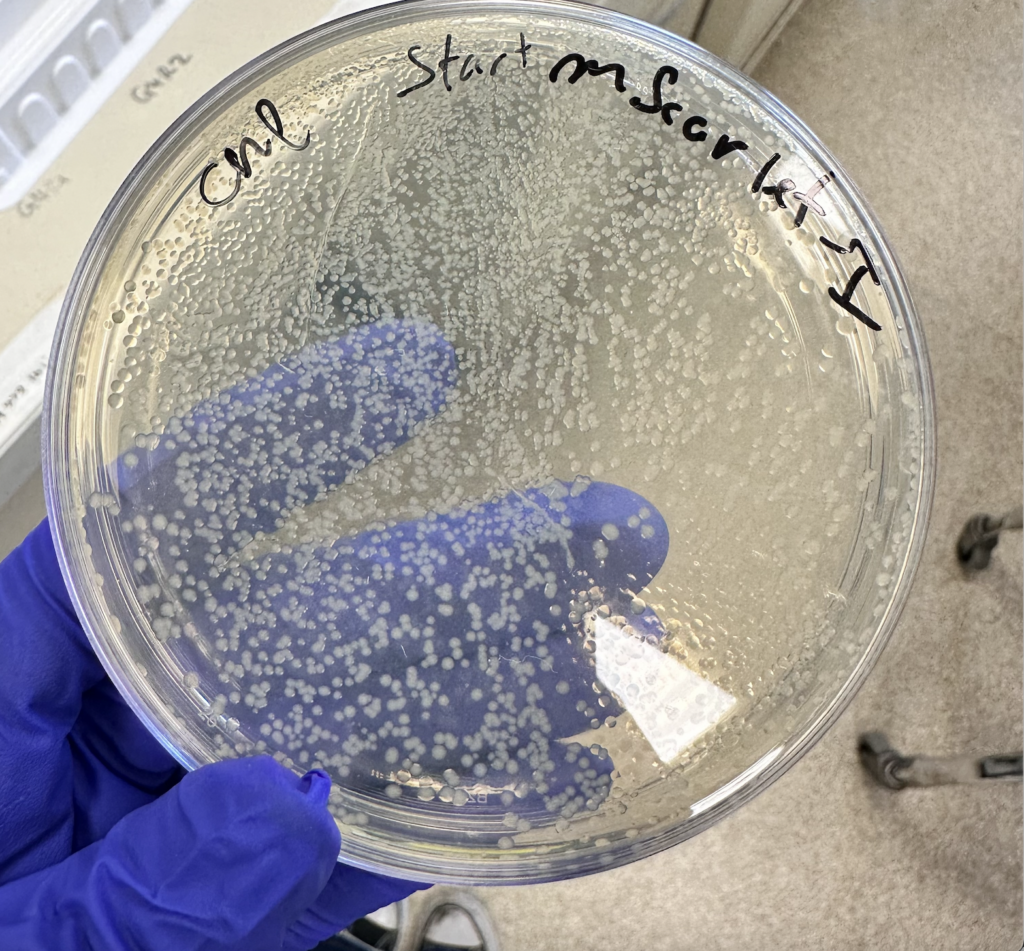
There are many ways to do it, but our chosen method is to grow colonies of the E. coli on antibiotic treated plates. Why? Because the start codon we attached also encoded a gene for antibiotic resistance, specifically the compound Chloramphenicol (“CHL”). So, in plating these microorganisms in a resistant media, survivors will be limited to the ones containing a start codon-MScarlet plasmid. This process is called “selection,” similar to natural selection in evolution, but artificially constructed to study bacterial traits.
After growing overnight, our plate was fully saturated with successful groups (Figure 3), Hooray! Now that we understood the state of the plasmids, our goal was to separate that genetic material from the E. coli; after all, our goal is to add them to Azospirillum in the end.
DNA isolation and extraction:
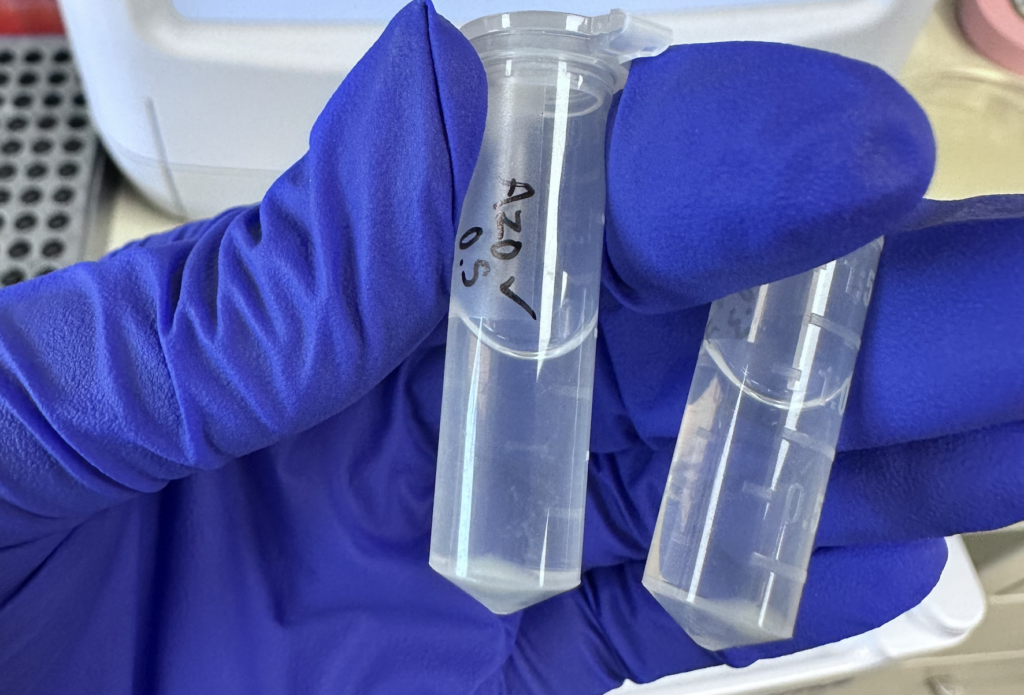
To extract the start-Mscarlet plasmids, we began by spinning (or what’s called “pelleting”) the E. coli down for 12,000 revolutions in one minute around the centrifuge. This process formed an opaque pellet of bacteria at the bottom of my tube, allowing for the empty solution to be discarded. (Figure 4, example)
Next, a suspension buffer was added to the bacterial clump in order to both re-liquify the culture, and dilute this next reagent– Lysis buffer; lysis (greek for “loosen”) is a disruptive solution that functions to dissolve the cell membrane and release genetic material inside. During this process, cells are killed, but if gently washed away, DNA remains intact and usable after the lysis is removed. So, our lysis buffer was added after the suspension buffer, and I gently inverted the tube and centrifuged the solution for another 12,000 revolutions.
After, we add the next step of DNA extraction: “stop N3,” an opposite of lysis that counteracts its ability to damage the cells, and precipitates (solidifies) the dead cell capsules (Figure 5). The dissolved bacteria received the N3, and were then spun at 13,000 revolutions per minute to spin out the dead cell gunk.
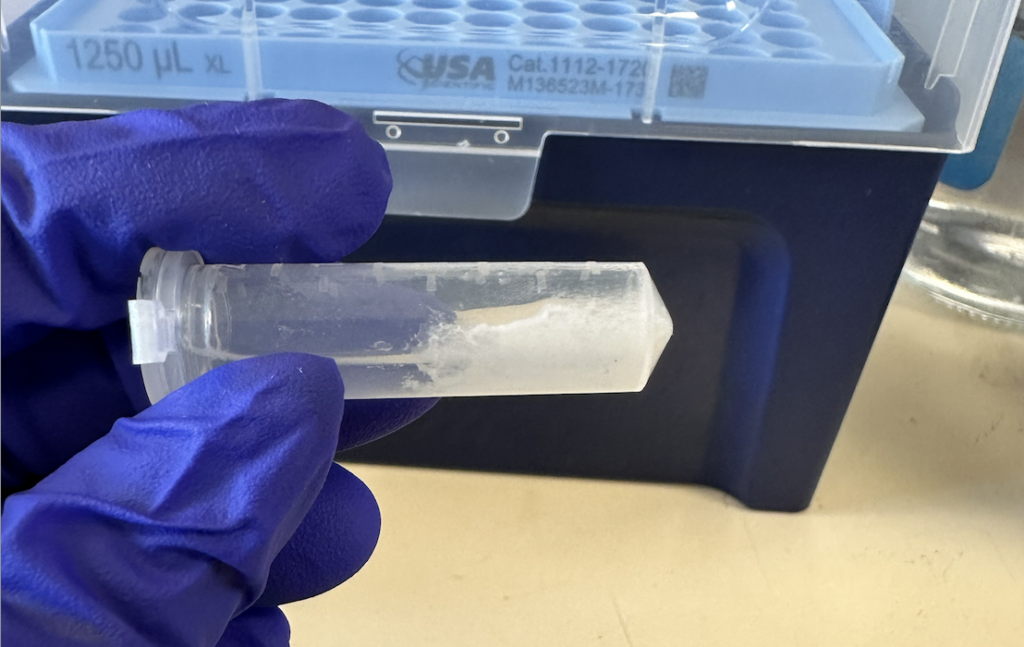
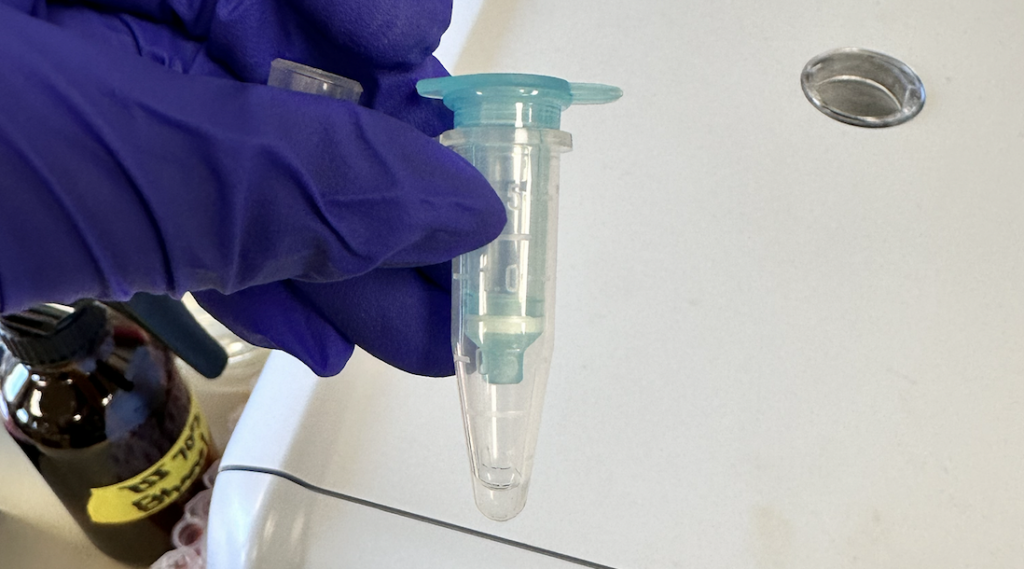
Finally, the leftover solution was added gently to a collection tube (Figure 6) in order to wash out the remaining discards and isolate the DNA completely. Taking a wash buffer, an additional liquid that dissolves cell matter, but plasmids are insoluble in, we rinsed out the tube. Then, DNA was collected using distilled H2O, which flushes out the water-soluble circular DNA.
In my humble opinion, science is security; this is because a vast majority of biology is entirely invisible to the human eye, therefore many steps must be taken to enlarge results to verify what we think is happening is actually happening. This is where the nanodrop comes into play!
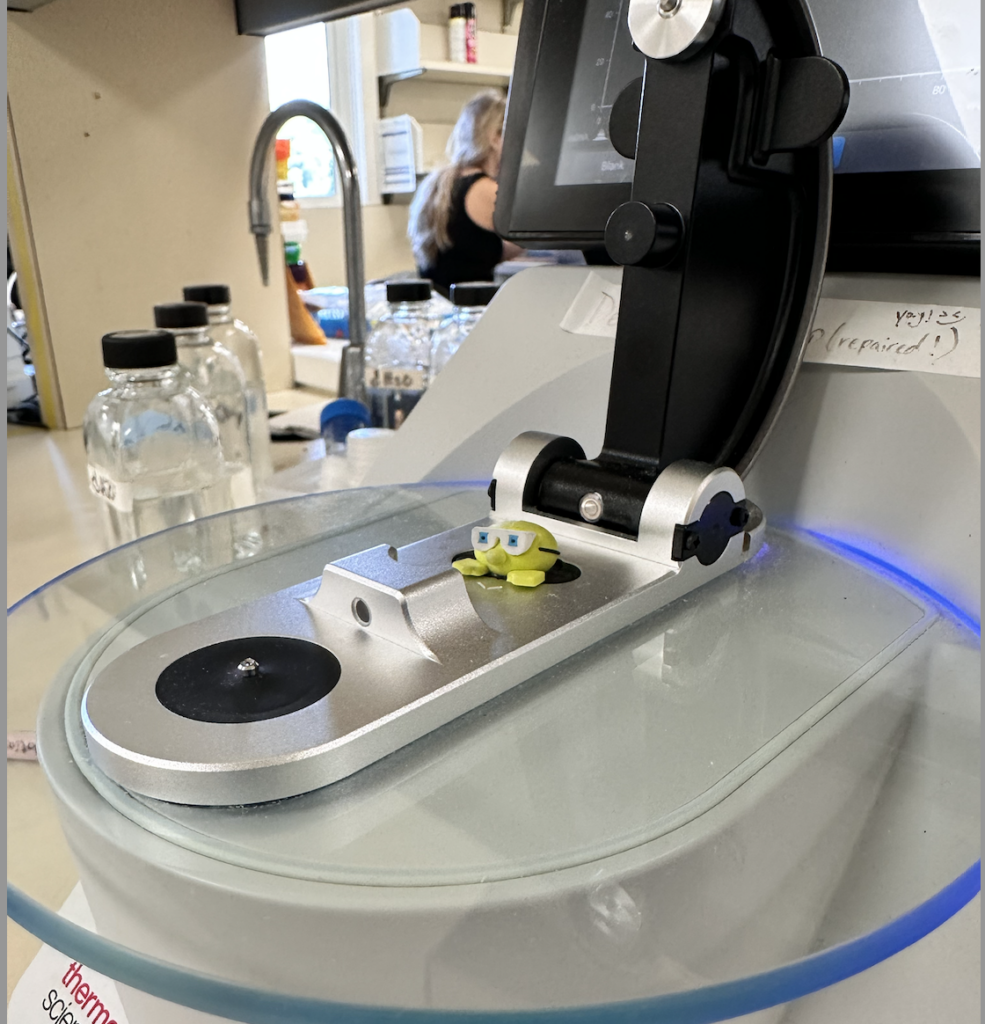
Through shining a light across samples of liquid, the nanodrop is able to determine concentrations of proteins, DNA, and RNA within them. Ours at CSHL takes a single microlitre of solution, and is overseen by a small minion attachment, very cute! This machine processed our E. coli-isolated plasmid, and pumped out the following image (Figure 7 & 8).
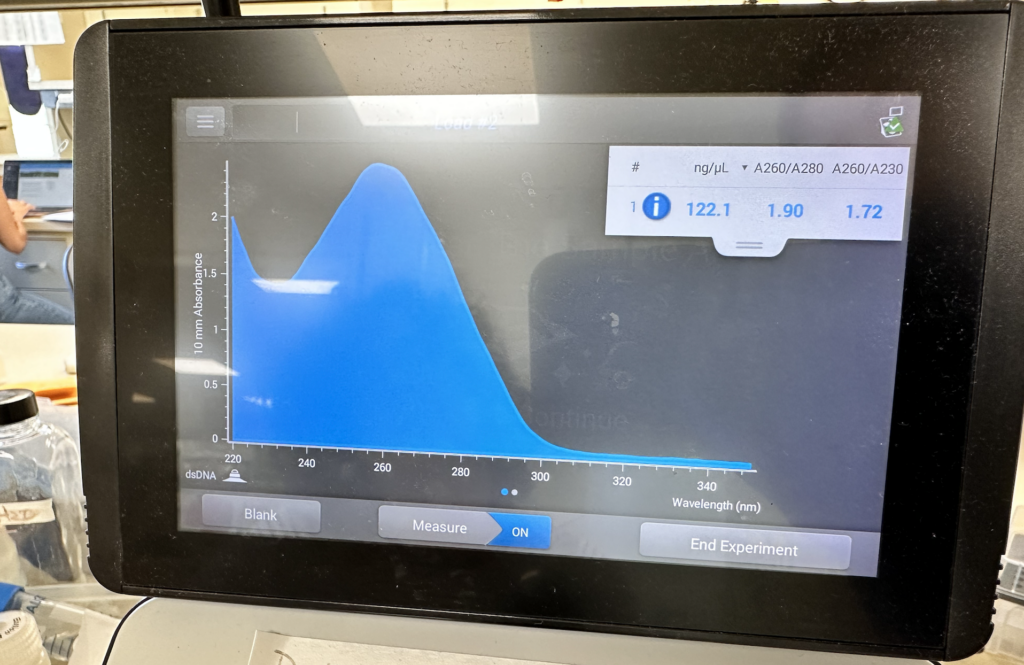
As you can see, the largest curve was present around 260 nanometers, this is wonderful! DNA is detected across that specific range, meaning that the reading of 122.1 nanograms per microliter can be assumed as our plasmid.
SP Videography:
So much genetic talk… I’d like to take a moment to share a definite highlight of my week at the lab now!
On Thursday, I had the genuine pleasure of working with Mrs. Jo Goldfarb (of BASIS Brooklyn) and Mr. Troy House to direct a tour of CSHL. Jo and Troy were the most incredible company, and Matias and I were able to participate in the filming of a fun project to be coming out after the Senior Projects! As I look forward to sharing these inside features, here is a preview of what’s to come: (Figure 9)
What’s Next?
Approaching the next week, my goal will be to treat the newly sowed groups with their needed treatments, aka A. Brasilense and Ammonium Nitrate. In the wet lab, we will take the isolated plasmids and begin to introduce a bacterial promoter, completing our fluorescent prototype. These genetic components will also be going through a “digest,” and “ligation,” (more on that later).
That’s all for now, see you all next week!

Leave a Reply
You must be logged in to post a comment.