Week 11: Agents and Acquisition
June 11, 2024
Hey plant people, thanks for joining me once again for Week 11!
Summary
Last time, I covered the bases of altering our greenhouse trial design to include different amounts of Earth soil. These changes were designed to allow for greater germination rates so that we can ultimately compare the plant growth across the concentration range of MGS-1. Other than the plant stuff, engineering our fluorescent Azospirillum has been going fairly well, with our E. coli test coming back positive for the start codon we added.
After verifying our success with the MScar-start template, we began a lengthy, but productive process of work of adding the bacterial promoter region for the final construct.
If you’re unfamiliar, I covered the relevance of each component of the plasmid in Week 8. But this week, we worked in three steps to finish the transgenic material: Addition, Digestion, and Ligation.
Addition of the Bacterial Promoter:
As mentioned previously, the promoter region of a genetic template is what encodes the amount of proteins produced by a cell, and where they are sent. By connecting a bacterial promoter, we are able to alter the fluorescent, coral derived-MScarlet plasmid to work in bacterial species (such as Azospirillum).
Thus, on Tuesday we thawed the MScarlet, start codon template strand as preparation for a PCR (Polymerase Chain Reaction).
Because the PCR system recommends 10-30 nanograms of DNA for plasmid preparation, we diluted our original 122.1 ng/uL DNA solution 10 fold (9 uL ddH2O : 1 uL plasmid), yielding a product of approximately 12 nanograms of material per uL.
2 uL of that dilution were added for a total of (12 + 12) 24 nanograms of DNA! **Here’s a small tip, it is typically good practice to add the largest volume of reagent when performing procedures of such small volumes. So note that before the 2 uL of template plasmid were added, we added 25 uL of MasterMix stock and 19 uL of distilled water. Then, we had to add 2 uL of PCR primers.
Primers are the incredibly important part of a PCR that determine what the final product will include. For some background, a PCR (Polymerase Chain Reaction), works by rapidly running DNA through a preset temperature cycle. This temperature cycle includes three important steps, and they go as follows (Figure 1):
Denaturation: double stranded template DNA is heated until unwound into two single stranded sequences.
Annealing: At a cooler temperature (specifics vary depending on the fragment), primers are allowed to “anneal,” or attach to the single stranded templates.
Extension: Utilizing floating base pairs within the MasterMix stock, a DNA Polymerase enzyme synthesizes a new strand of DNA starting from the primer. The bases are bonded through the enzyme onto the single strand, forming an end product of new DNA.
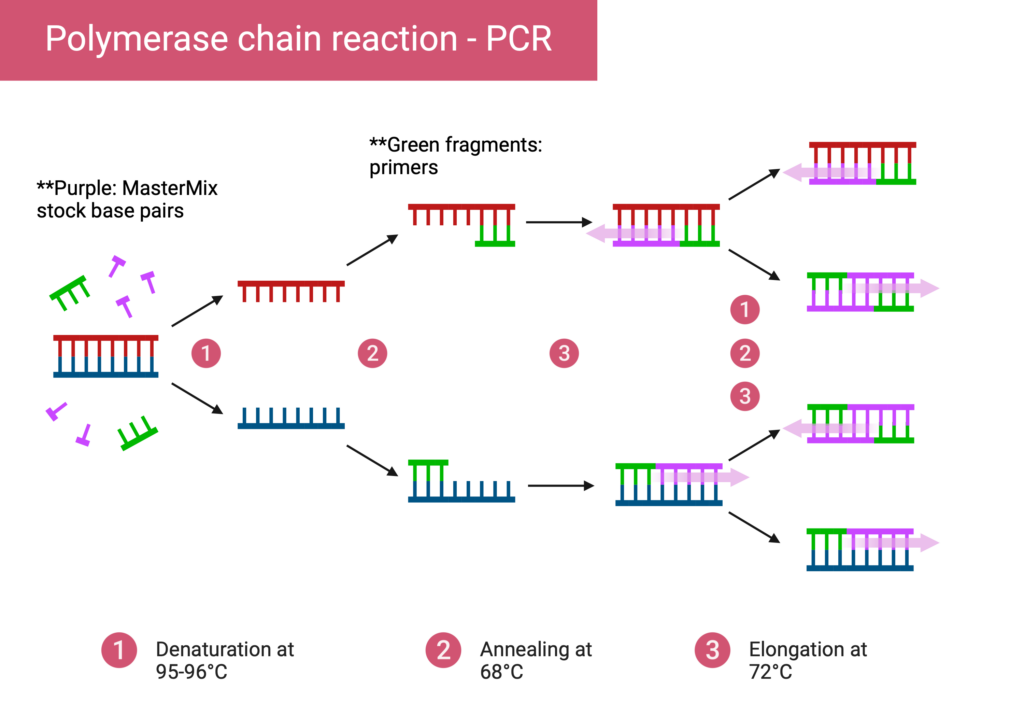
After the entire PCR, genetic material is amplified as the steps repeat until the concentration has increased exponentially.
Now, the primers that researchers select determine the location that DNA Polymerase begins to form the new DNA. This means that adding the primer that both encodes for your gene of interest, and connects correctly to the base strand is key. To do so, Matias and I worked using SnapGene, a sequence simulation providing insight into the plasmids of our project.
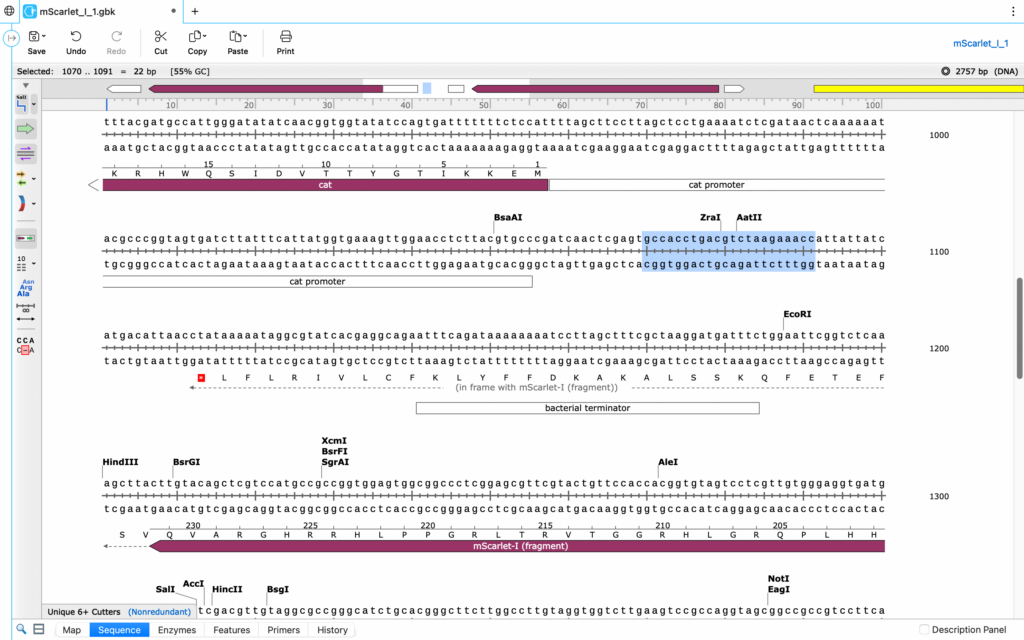
PCR primer design is a delicate art. You have to include what’s called a “GC clamp,” a Guanine-Cytosine pair at each end of the sequence; this is because GC base pairs contain triple bonds as opposed to the Adenine-Thymine double bond of weaker strength. The clamp ensures that your primers are strong enough as to not come apart at their ends during the denaturation phase. Further, at least 50% GC content is needed throughout the entirety of your primer, to prevent any splitting around the rest of the strand.
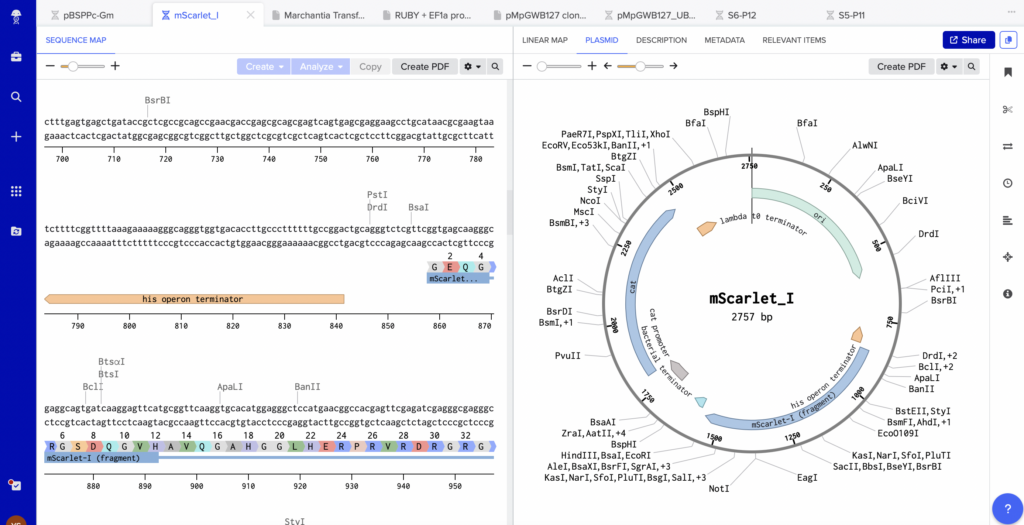
Simulations like SnapGene (a free alternative is benchling.com, figure 3) allow researchers to pursue this specific purpose, displaying the GC content, melting temperature, and other relevant details for highlighted sequences of DNA. So, in utilizing SnapGene and Matias’s guidance, I designed the two primers (Forward-FW and reverse-RV) needed to attach the bacterial promoter (labeled “bac” for brevity) to the MScar-start template. These are the two that we settled on and ordered for the week:
FW: aagcctgttcggttcgtaaactGGGTCTCGTATGGTGAGCAAGG (52.2% GC)
RV: tacgaaccgaacaggcttatgtCAAGGTGTCACCACCCTGCC (54.7% GC)
**lowercase letters include where the primer will be synthesized, while UPPERCASE letters are the region that anneals to the template strand.
They arrived at the lab before our transformation procedure, so we proceeded accordingly. Each primer comes in a dehydrated form, and must be both rehydrated and diluted. Distilled, nuclease free water was added to each tube, and spun down via centrifuge at 12,000 rpm. The resulting product was mixed with a micropipette, with 10 uL taken out and diluted by a 90 uL amount of distilled water.
After preparing the primer solutions, 2 uL of the FW and RV were added to the PCR mixture mentioned above; the resulting solution was 50 uL that we soon added to a PCR thermocycler. (Figure)
Gel Electrophoresis:
Post PCR, we verified the length of the plasmid through Gel electrophoresis– a method of measuring DNA based on its mobility relative to electric charges (Figure 4).
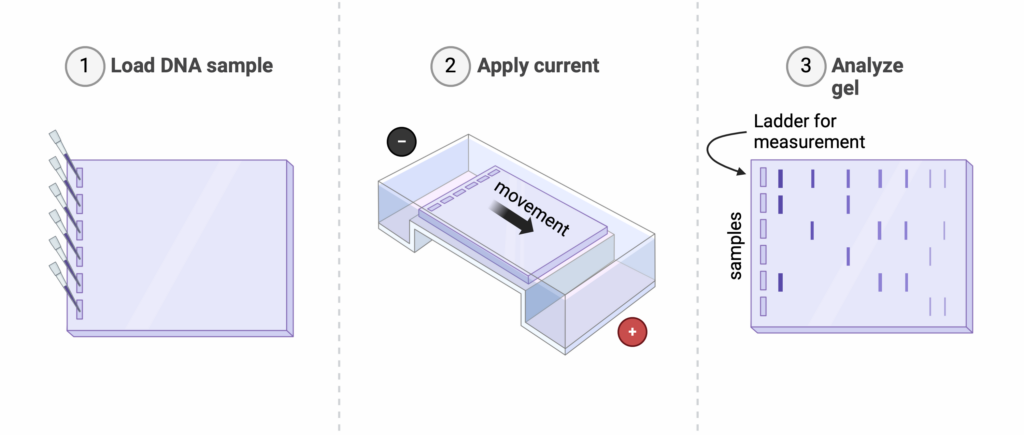
Here are the basics:
Given a sample of DNA like ours, we take around 5 uL of plasmid solution and mix it with a loading dye, weighing it down as well as staining it to be visible. In an electrophoresis tank filled with buffer solution, the mixture is inserted into wells along with a ladder (reference material containing many different lengths of DNA).
Because DNA possesses a negative charge, placing small amounts onto a porous material like agar (and here’s the key) with positive and negative electrodes active allows the DNA to move away from the negative electrode and towards the positive (opposites attract). This mobility is dependent on the length of each fragment; larger strands of DNA (ex. 10,000 bases) will move less as they are heavier relative to their smaller parts (ex. 500 bases).
Our intended plasmid with all of its parts (start codon, bacterial promoter, and MScarlet genes) should be approximately 3,000 base pairs in size. And so, measuring it post-charge against the appropriate DNA ladder allowed us to verify its completion (Figure 5).
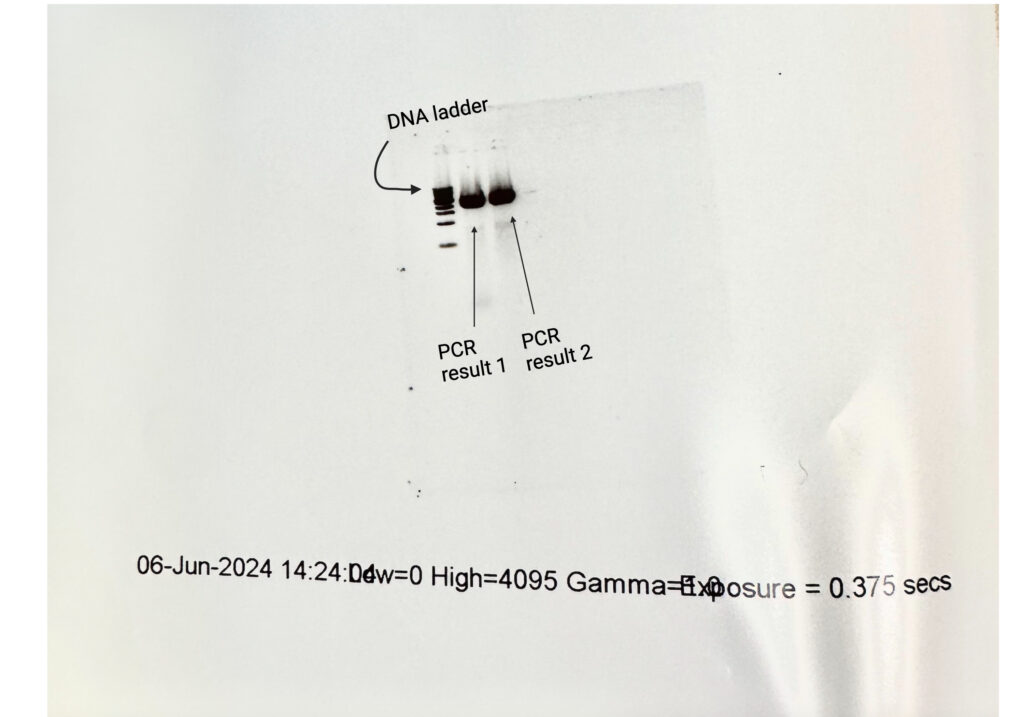
Success! Our PCRs both matched clearly at the 3 kilobase mark, with the first result looking slightly more clear. (**note: I ran two PCR tubes because I’m a novice, and one might have failed during the many steps; more experienced molecular biologists would likely only need one)
Digestion of Foreign Contents:
Welcome to step two! After measuring the DNA with our gel, I decided to take an additional step for security– the Plasmid digest.
Digests have one goal: remove all foreign contents/fragments from a sample of DNA (the start-bac-MScar in our case). To do so, we gently mixed it in solution with an Exnase enzyme. Exnase is quite an interesting tool for genetic engineering! Roughly, it disassembles natural genetic material based upon their elements, but completely ignores the presence of synthetic DNA, eliminating the waste products from transgenic manufacturing.
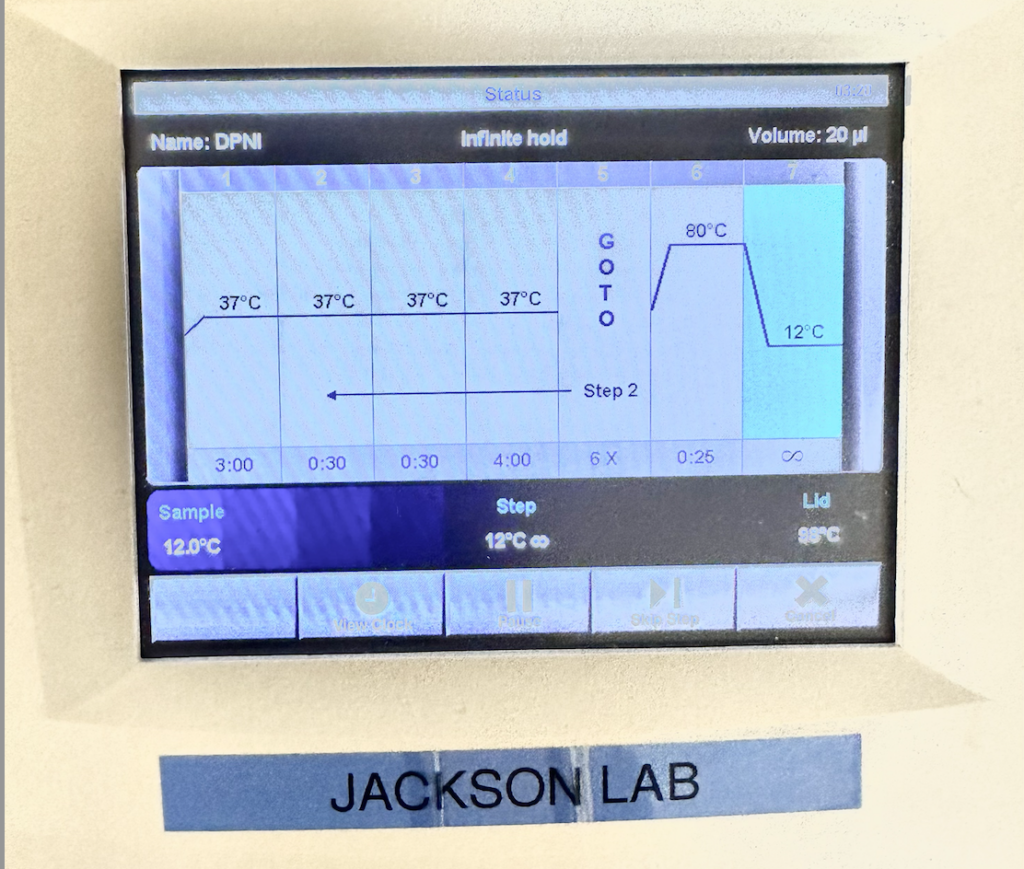
During this process, ~500 nanograms of plasmid were added (3.5 uL of 122.1 ng/uL solution) to a mixture of distilled water (14 uL), buffer solution (3 uL), and Exnase enzyme (0.5 uL). A temperature cycle was used to store, activate, and control the enzymatic reaction, this took place in another PCR machine. (Figure 6)
Ligation of Linear DNA:
We’re on the final stretch! I previously explained how plasmids are circular structures of DNA that are present in many bacteria, however, when PCR is performed, the denaturation step disrupts the loop of DNA, turning it into a linear sequence. Although our PCR products are now successfully 3 kilobases, and waste-free, they still must be turned into a form with that circular shape. This process is called Ligation. (Figure 7)
Ligation occurs through the use of another enzyme, ligase; it alters lines of DNA by joining two complementary ends together and forming our desired structure.
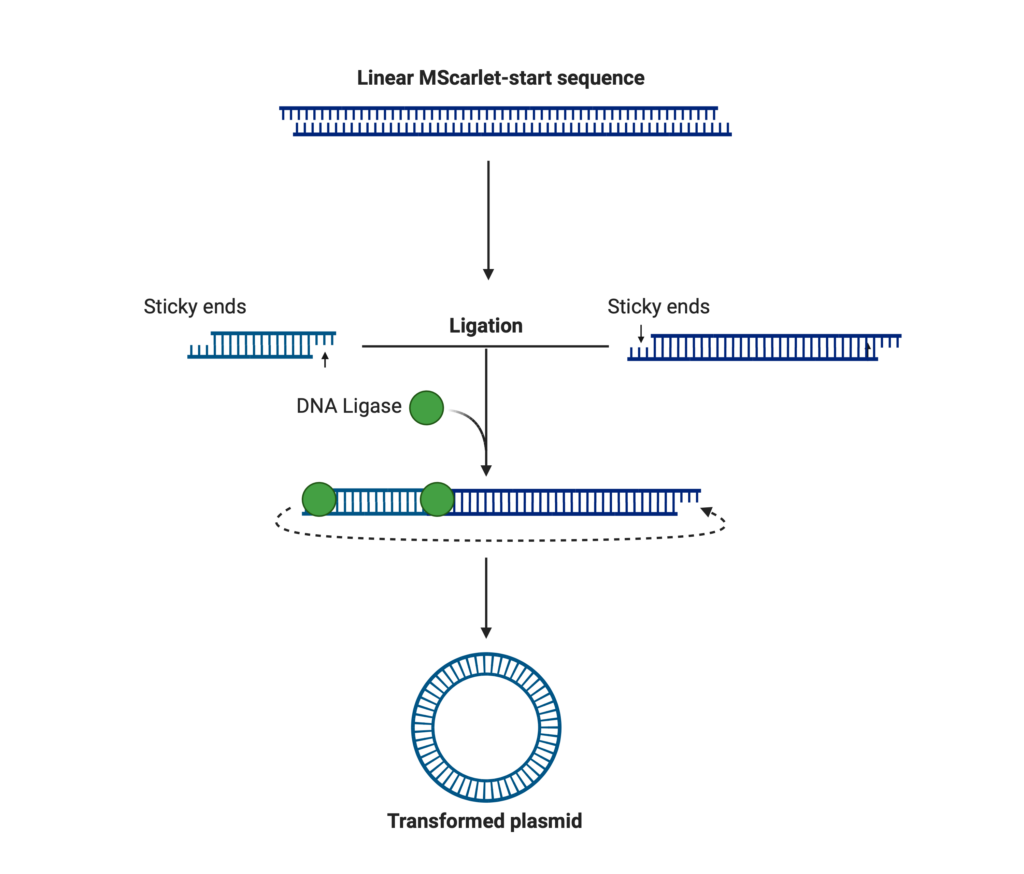
In our ligation, a recommended 2.5 uL of plasmid were added into distilled water (20 uL), a buffer solution (4 uL), and ligase enzyme (2 uL).
Finally, the circular, digested, bac-MScar-start plasmid was completed and stored frozen.
Greenhouse: Treatments
Now for the plant stuff… opening last week with a new trial of plants means that this week is treatment time! This time around we have two solutions of interest: the A. Brasilense and (new!) chemical control Ammonium Nitrate (Figure 8).
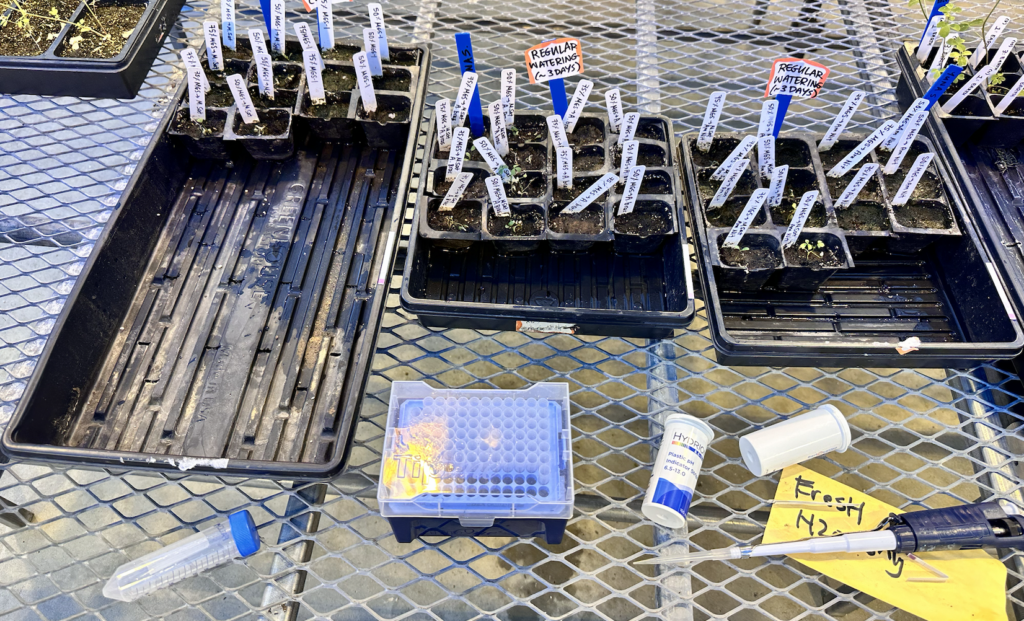
Azospirillum Brasilense was prepared at the previous concentration of 75 mg in a 50 mL solution, which is approximately 3,000 colonies per plant insert. To cover the full 4.15 square inches of each insert, 1079 uL of bacteria was pipetted around each plant.
Ammonium Nitrate was weighed in at 1195 mg and suspended in 25 mL of distilled water. This solution is accurate to the 224 kg/ha scale recommended by agriculture experts. 1,000 uL of the nitrate solution was pipetted into each insert.
Greenhouse: Plants:
As for the progress in growth, the earth supplementation seemed to have worked to increase germination rates! This was a major relief after struggling with the soil’s unforgiving chemistry for so many weeks; the plants grew the lowest in MGS-1 without any treatment (Both 50% and 75% groups), and the highest in our A. Brasilense 50% MGS-1 (Figure 9). Ammonium Nitrate 50% MGS-1 groups followed shortly after.
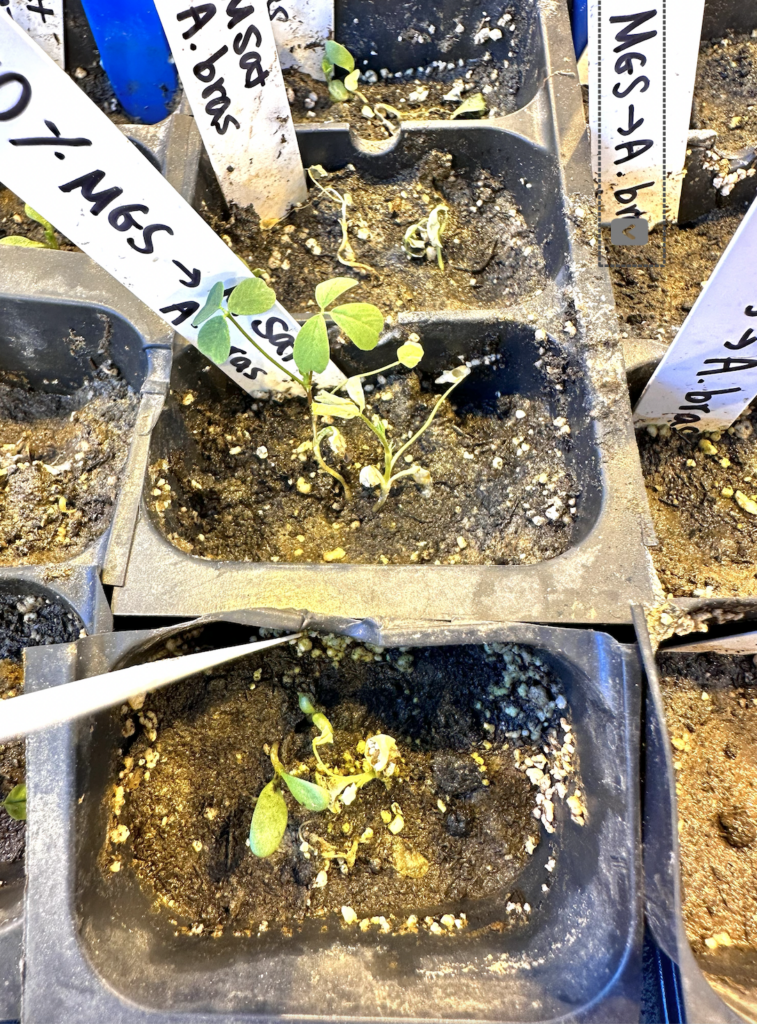
Although these are just the first week of plants, I’m ecstatic to watch their progress!
That concludes an eventful 11th blog… thanks so much for reading and I look forward to updating next week, Ciao!

Leave a Reply
You must be logged in to post a comment.