Week 9: Connecting the Dots
April 29, 2026
Hello, correlation connoisseurs! After weeks of collecting and organizing data, this week I’ve shifted my focus toward finally analyzing the correlations among graphs that directly compare advertising airtime with public awareness and prescription-related outcomes.
From Individual Graphs to Direct Comparisons
Until now, I’ve been looking at each dataset individually, and while this helped identify general patterns, it didn’t help me answer my central question of whether increases in advertising directly correspond to increases in public awareness and sales trends?
To address this and directly seek out the correlation, I created new graphs that plot airtime vs. search frequency, airtime vs. social media post frequency, and airtime vs. sales trends for all three drugs. By visualizing these relationships, I can begin to see whether increases in advertising aligns with measurable changes in public behavior.
Plotting these different datasets against one another will help me approximate a trendline and determine whether there is a negative or positive correlation depending on whether the slope of the line is positive or negative. Additionally, when determining the trendline, I will be able to decipher the R2 value. R2, otherwise known as the coefficient of determination, is a statistical measurement that determines what proportion of a dependent variable can be predicted by an independent variable in a regression model. This measurement ranges from 0 to 1 with 1 indicating a perfect fit of the model to the data. For example, a graph that plots airtime vs. search frequency and outputs an R2 value of 0.995 would indicate a high fit, meaning that airtime and search frequency heavily correlate to one another.
Airtime vs. Search Frequency
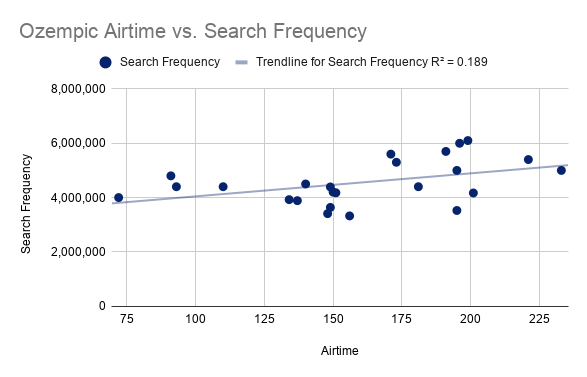
When comparing airtime with search frequency, there appears to be a very small positive correlation for Ozempic and negative correlations for SKYRIZI and DUPIXENT. For Ozempic, periods with higher advertising exposure tended to slightly align with increases in search activity, though not perfectly synchronized, hence why the R2 value is quite low despite the positive correlation.
As for SKYRIZI and DUPIXENT, both graphs displayed the slightest negative correlations with an evidently small R2 value. When comparing these two drugs to Ozempic, it’s clear that Ozempic’s prevalence on the news and popularity amongst celebrities might be a strong contributing factor to the positive correlation displayed. However, looking at these more generic, less mainstream drugs that haven’t been popularized across the internet, it’s much more evident that advertisements don’t inherently correlate with search frequency.
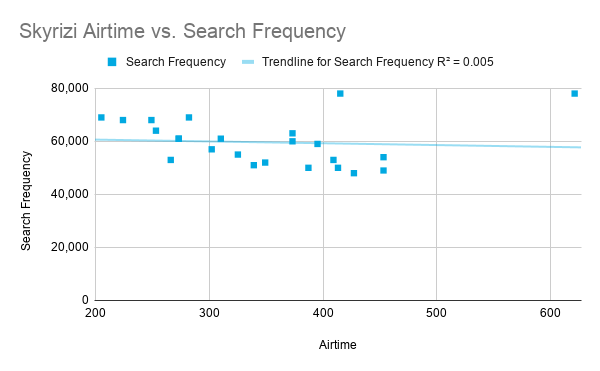
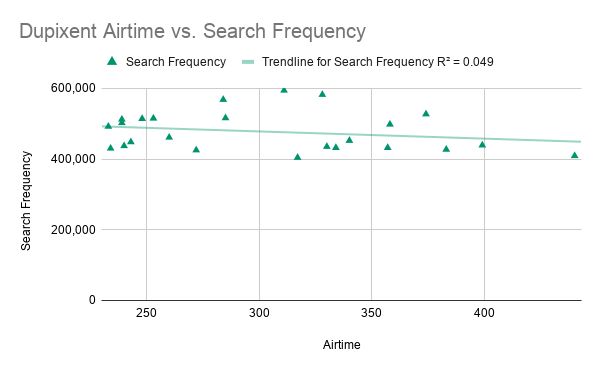
All three drugs had a relatively low R2 value. Ozempic had an R2 value of 0.189, SKYRIZI had one of 0.005, and DUPIXENT had a value of 0.049. These values indicate that advertising airtime explains only a small portion of the variations in search frequency, suggesting that while there may be a small correlation, it is not particularly strong. Ozempic’s higher R2 value implies a slightly more clear connection between advertising and search behavior, but still, less than 20% of the variation in search trends can be linked to changes in airtime. For SKYRIZI and DUPIXENT, the extremely low values suggest that there may be other external factors, such as word-of-mouth or other health trends, that play a much larger role in influencing search activity as opposed to advertising alone.
Airtime vs. Social Media Post Frequency
A similar pattern persists when comparing airtime to social media post frequency. Increased periods of advertising generally have minimal effects on levels of online discussion on Reddit. Similar to Google search trends, Ozempic continues to persist as the only drug with a positive correlation, while the other drugs have a more strong negative correlation.
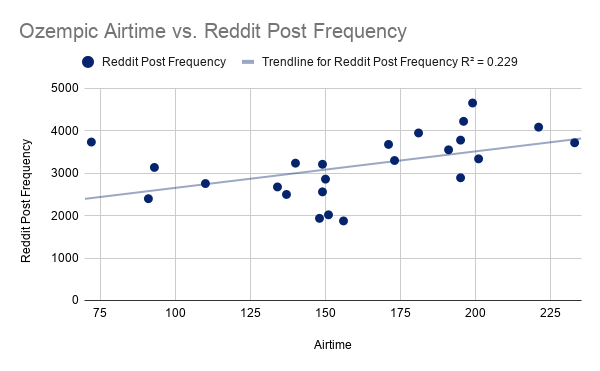
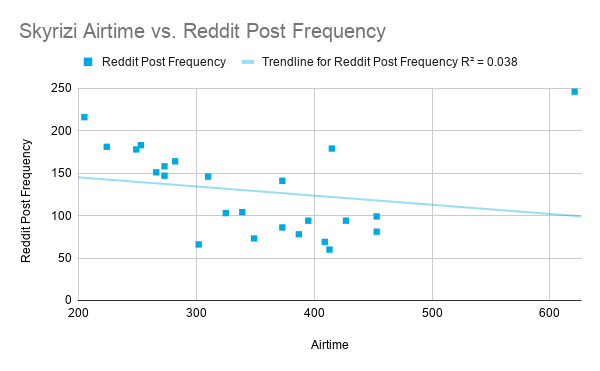
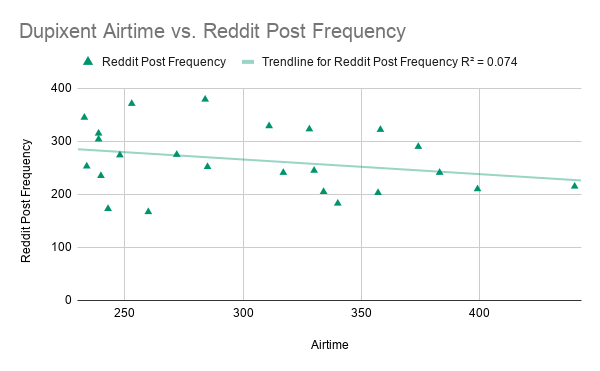
However, these correlations appear to be more consistent than search trends, as the trendlines on these graphs appear more significantly negative or positive. This is likely due to the fact that social media activity is less varied and influenced by additional factors compared to Google searches as a whole.
Once again, all three drugs had relatively low R2 values. Ozempic had a slightly higher R2 value of 0.229, SKYRIZI had one of 0.038, and DUPIXENT had a value of 0.074. Similar to the search frequency analysis, these results also indicate that advertising airtime is not a strong correlator of social media post frequency. Although Ozempic shows a somewhat stronger relationship compared to the other two drugs again, its R2 value still suggests that the majority of variation in social media activity may be driven by other external factors rather than advertising being the main leading factor. The slightly higher values in this comparison indicates that social media discussion is a slightly more responsive to advertising than search behavior, but the overall weakness of these R2 values continues to indicate that online engagement is more likely affected by a wider range of variables.
Airtime vs. Sales
While overall sales increase from 2023 to 2024 for all three drugs, the connection to advertising appears to be more complex and gradual, as the number of ads per year do not indicate a positive correlation to the changes in sales figures.
Unlike search and social media trends, sales trends only reflect long-term growth measured once per year. Due to this form of tracking, I could not calculate an R2 value for airtime vs. sales data, as two points would resemble an R2 value of 1 since the trendline would be a straight line.
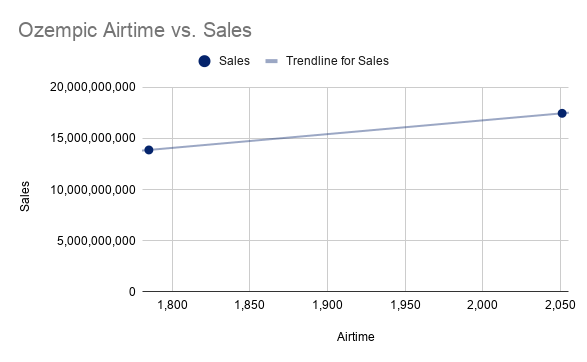
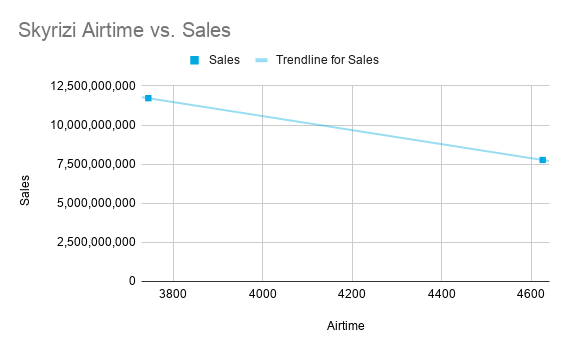
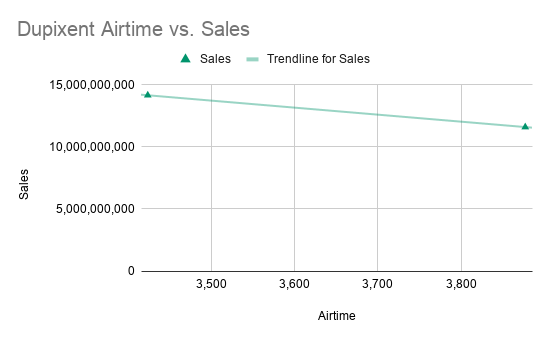
By visually observing the airtime vs. sales graphs, there appears to be the consistent trend of Ozempic having a positive correlation, while SKYRIZI and DUPIXENT still have a negative correlation. Despite increases in advertising, SKYRIZI and DUPIXENT’s trendlines do not depict an increase in sales aligned with more advertisement exposure. Meanwhile, Ozempic continues to display that increases in advertising correlated with increased sales. At the moment, these graphs indicate that Ozempic is the one drug that has enough advertising presence and outreach influenced by that presence to portray a significant increase in sales that may be attributed to advertising.
While these visual comparisons provide many valuable insights that have differed from what I originally predicted, I still need to conduct further statistical analysis to determine whether these relationships are truly statistically significant.
Citations
Fernando, Jason. “What Is R-Squared?” Investopedia, 13 Nov. 2024, www.investopedia.com/terms/r/r-squared.asp#toc-what-is-r-squared.
Leave a Reply
You must be logged in to post a comment.