Week 10: (Grand) Finale and Final Presentations!
May 9, 2024
Hi everyone! This week has mostly been focused on grinding out my final product (a poster) and beginning to make my Senior Project Presentation. This week at lab, I did some more genotyping of a female mouse and her pups, met with Dr. Laird (my advisor’s PI) to update her on my project’s progress, and then imaged the reconstituted ovaries under the confocal microscope.
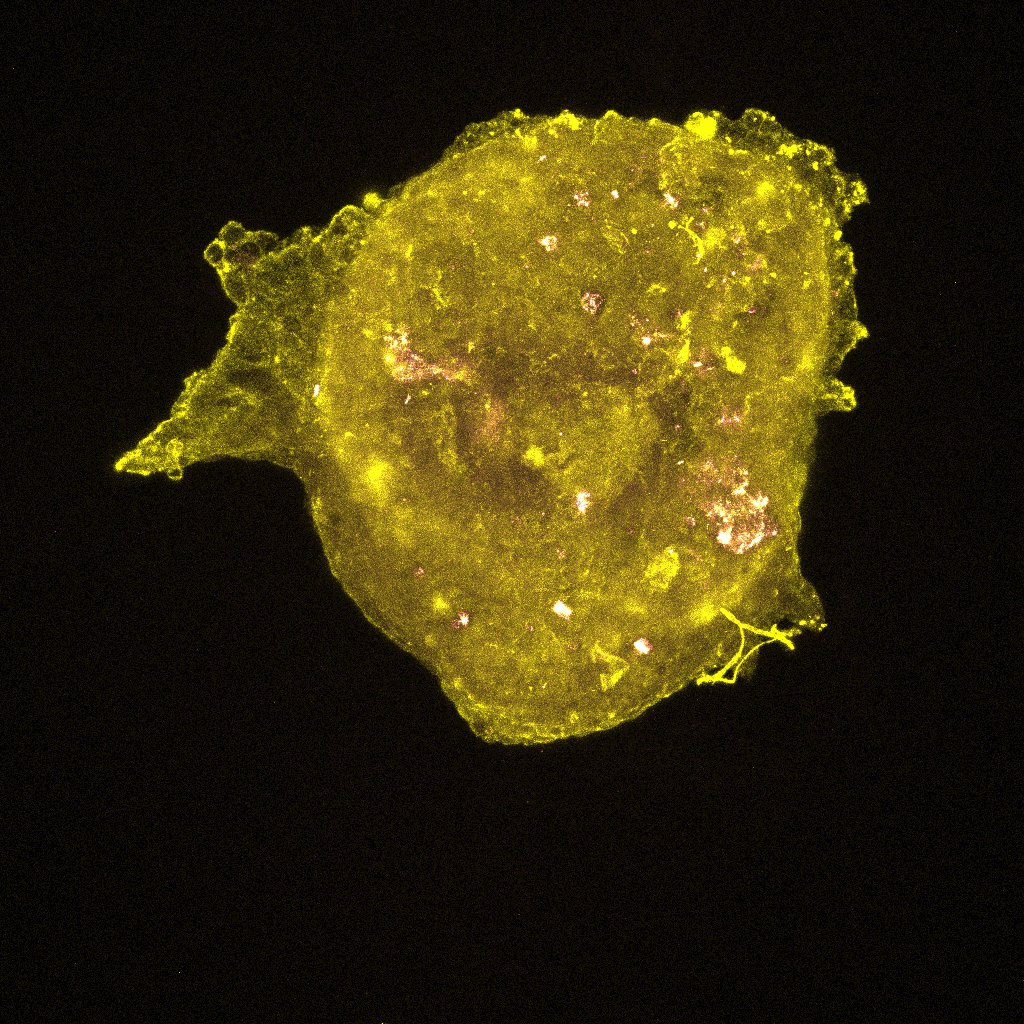
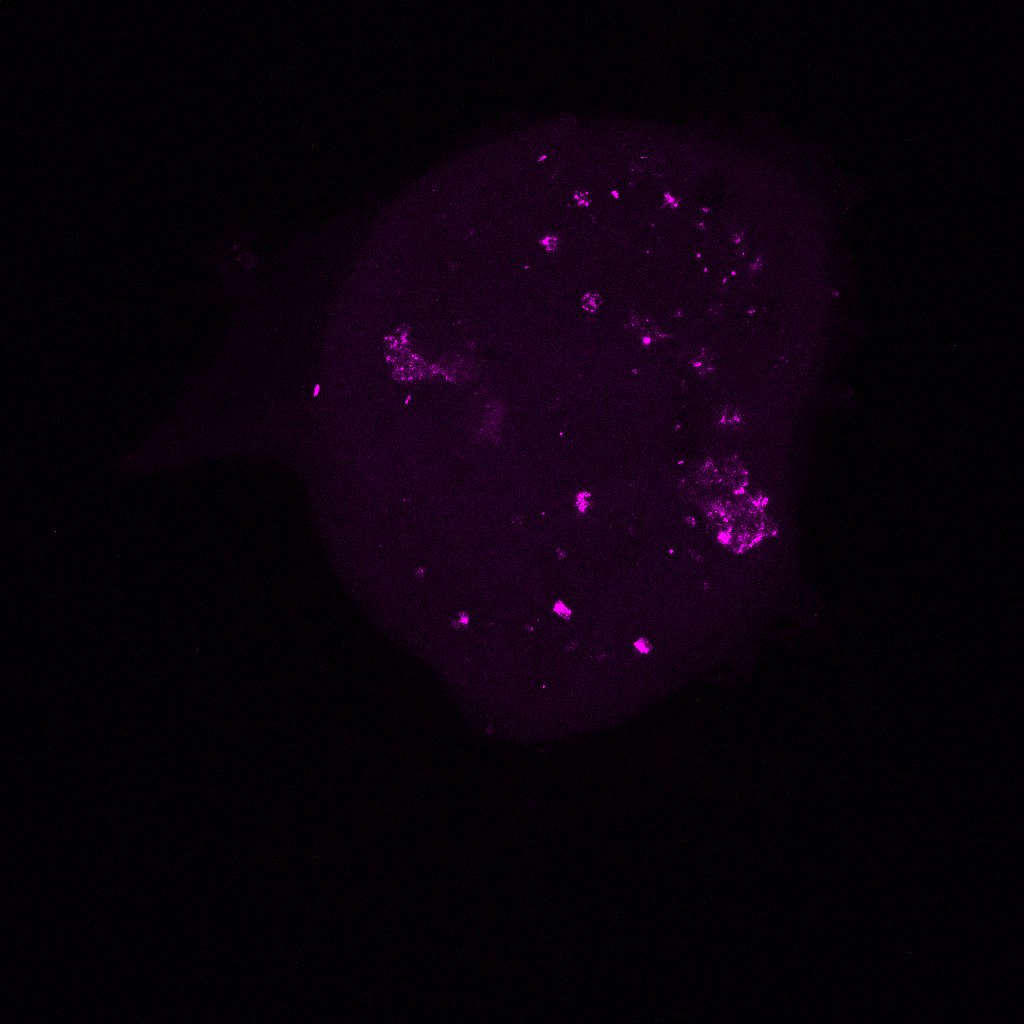
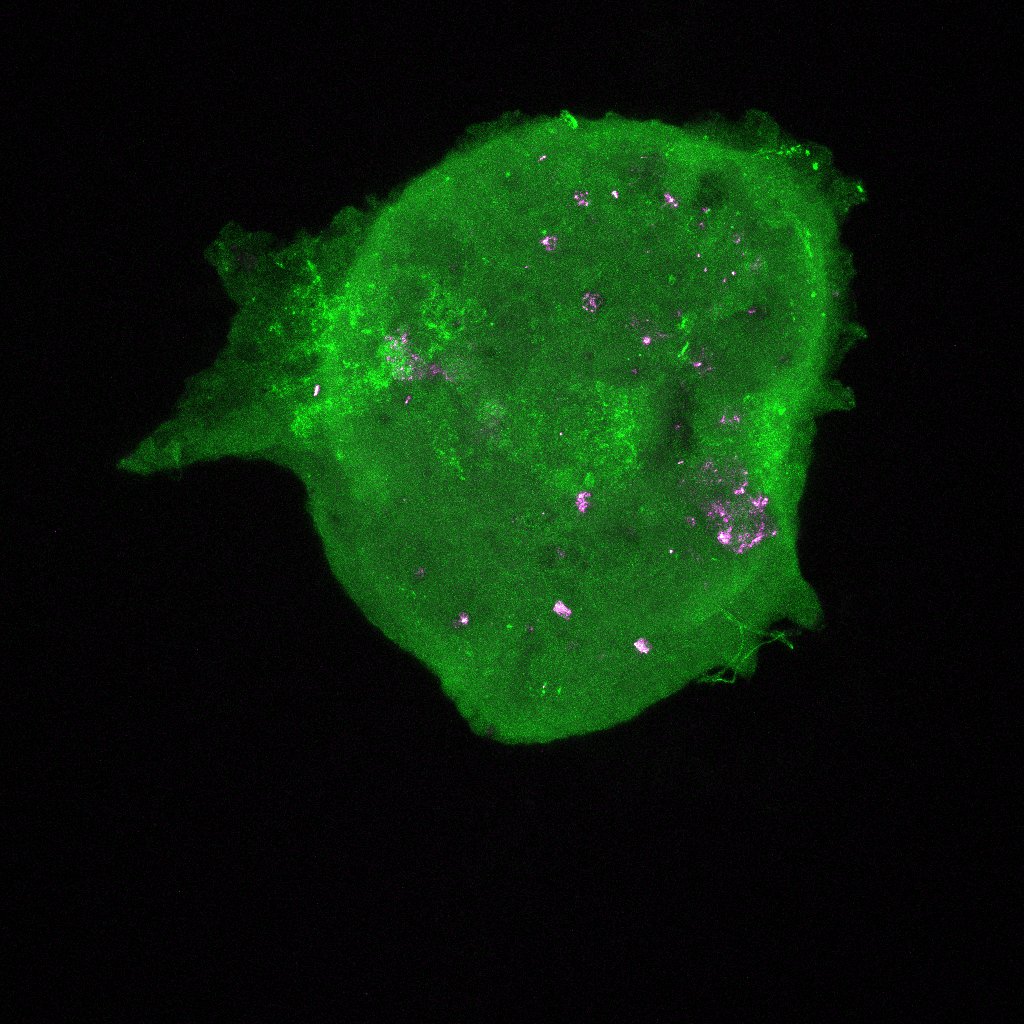
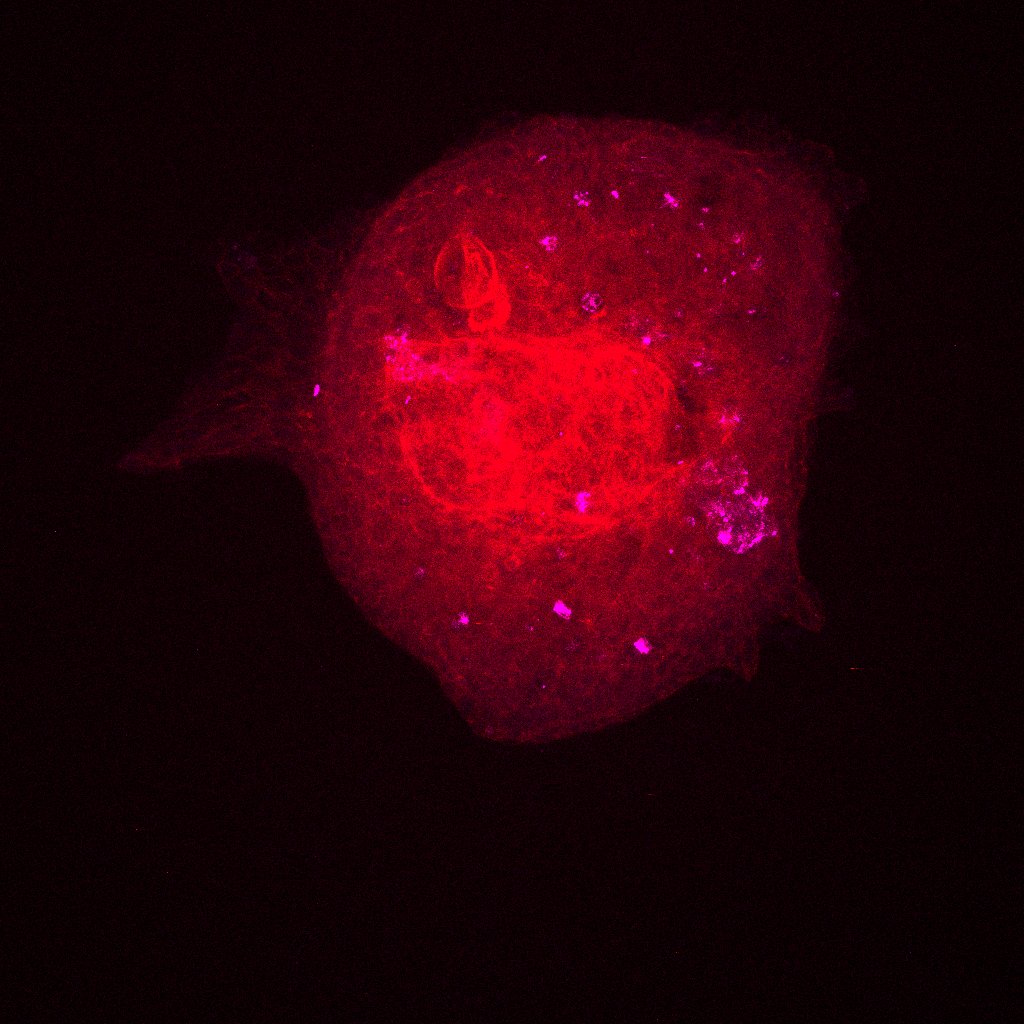
We took the reconstituted ovaries that were sitting on the slides in the dark (we do this to reduce photobleaching, which decreases the fluorescence in the sample as a result of light exposure). The images we generated after putting the slides under the confocal microscope let us see the different proteins we stained for (FOXL2, VASA, Oct4GFP) in the reconstituted ovary along with the DNA and actin stains (DAPI and Phalloidin) we put in. The imager uses a laser to scans in horizontal cross-sections to quantitatively measure the fluorescence generated by the specific antibody binding (for the proteins) and the specific stains. If the reconstituted ovary replicate (like our 5k replicate) was too big to image in one go, the laser sectioned it into 4 and then stitched the respective images together at the end. The images were all so beautiful! We saw strong expression of the VASA and Oct4GFP (showing us we had oocytes as these are oocyte and germ cells specific) and FOXL2 in cells surrounding the oocytes (granulosa cells). These indicate we are seeing proliferation of the granulosa cells around the oocytes into what are now primordial follicles, which is amazing and shows us that our scaledown actually worked! Additionally, we see much fewer oocytes than the oogonia we started with, which indicates to us that oocyte selection is in fact happening. Now, we must figure out what made those surviving oocytes better or different than the rest. How to we do that? By examining the primordial germ cell (PGC) migration pathway and tracking heterogeneity, as I am doing in the computational analysis of this project! I also did some regular imaging with the tissue culture microscope of the new reconstituted ovary replicates we are testing. So far, we tested 5k, 3k, and 1k replicates. However, we started with 3 1k replicated on the 96 well plate, out of which only 2 aggregated and survived well — these were the ones we could see under the confocal microscope. As a result, to continue to optimize the scaledown we are testing a 2k replicate as well!
Here are some images! These are the colors in the images and what expression they are measuring:
- DAPI for nuclear DNA staining (Blue)
- FOXL2 for pre-granulosa and granulosa cell staining (Yellow)
- VASA for oocyte staining (Magenta)
- Oct4GFP for germ cell staining, although Oct4 downregulated in oocytes compared to oogonia (Green)
- Phalloidin for actin staining (Red)
These are images of the 1k replicate under the confocal microscope. I’ve shown all the stains with VASA (magenta) so we can see where the oocytes are in every image.


Wednesday was a meeting day! I attended the lab meeting in the morning followed by a 4-hour workshop on genomic analysis and sequencing, which I didn’t understand. But hey – I got a free lunch (and cookies) out of it! Sounds like a win to me.
To recap: The question I asked at the start of this project was how differences during the PGC migration impact germ cell selection later on during development. To do this, I wanted to first understand the heterogeneity that exists among the migrating PGCs. That includes answering questions like, how do the migrating PGCs interact with their somatic microenvironment? What signals or interactions affect the PGC migration and more specifically, their proliferation, survival, and development? Identifying these differences can help us make a sort of atlas of the molecular profiles of these PGCs spatially and temporally, which can help inform us more about this migration factors into germ cell developmental potential. Through the computational analysis we’ve done, we have been able to note heterogeneity through differences in gene expression, cell-cell communication, and the presence of gene sets, networks, and pathways among PGCs — analysis that we’ve done through timepoint and position comparisons.
PGC migration is awesome, but we also want to be able to observe germ cell selection as it happens. This is especially relevant during later stages of development as the germ cells commit to become female germ cells (oogenesis, beginning with the formation of oogonia) and eventually, only a few of these committed female germ cells are recruited to join the ovarian reserve. By this I mean that many of these cells will be killed to ensure that only those of the best quality get the go-ahead to become eggs!
To see selection, we want to see which descendants of the germ cells we add will survive all the rounds of oogenesis and development. Specifically, we are now interested in the E13.5 timepoint as it has the peak of all the germ cells we will ever make. Reminder! E13.5 germ cells have committed to becoming female germ cells in female embryos, and they are now called oogonia.
Tracking selection warrants a technique called “lineage tracing.” Lineage tracing involves labeling or “barcoding” cells of interest as a way of uniquely identifying them. Following barcoding, we can observe the descendants – or lineage – of our labeled cells. To observe this lineage tracing, we need to make – you guessed it – reconstituted ovaries! We used a protocol from Hayashi et al., 2017 as our reference, which directed us to make a relatively large reconstituted ovary. But since retrieving the cells necessary to make big replicates of these ovaries is very difficult (getting large amount of oogonia and somatic cells from dissections and FACS is complicated), we wanted to explore this model to see how much we could manipulate the sizes of the reconstituted ovaries. Specifically, we wanted to see how much we could scale this model down. Since this was more of a pilot experiment, the cells we used were not particularly labeled when they were put in, so we can not do any lineage tracing right now. We can, however, note from our results that this reconstituted ovary model does in fact works for observing germ cell selection (as we saw with the oocytes earlier in the blog). Once we optimize this, the next time we can label the germ cells and then turn this into a lineage-tracing experiment that will tell us all about the oocytes the labeled oogonia give rise to!
What a ride it’s been! While I won’t be blogging about this project anymore, I will still be genotyping, sorting, dissecting, analyzing, and imaging for a few more weeks as part of my internship. Super excited for what’s to come! Don’t miss me too much
Finally, I’d like to give the biggest shout-out to my onsite advisor, Jay Zussman, for generously letting me be a part of their science these past few months, and for all the wonderful support, guidance, mentorship, and opportunity they have given me in this internship! Science is cool, but it’s even cooler when you have a super duper cool advisor. Thank you to the Laird Lab for allowing me this experience and providing me with the resources for this project, and to Dr. Chaudhri and Ms. Nagpal for their supervision and direction in this process.
Wishing everyone the most wonderful and relaxing summer!!!
– Anjali


Leave a Reply
You must be logged in to post a comment.