Week 3: Unraveling the Full Model
March 15, 2024
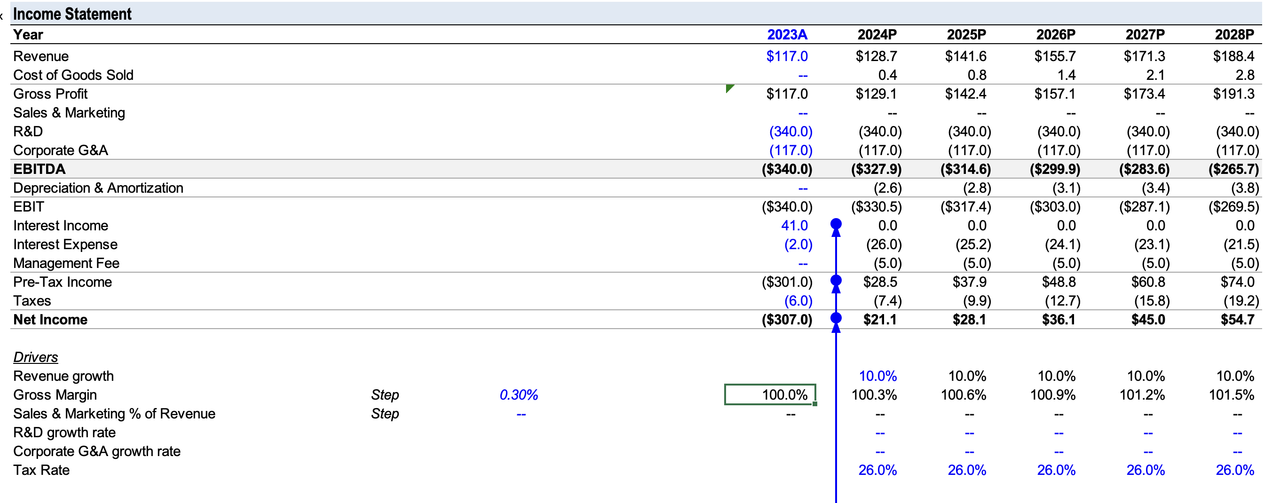
Welcome back for the third week of my project. Shooting off of last week’s napkin/paper LBO model I began to construct the full LBO chart. This week mostly consisted of number crunching as I began to dissect the target company’s (Arcus) financial data reported through public SEC filings. I started by matching Arcus’s income statement data onto a chart of my own. Through this process I was able to do a surface level investigation of their financial position and deemed that they were burning too much cash. In their reported data we can see that their R&D costs are incredibly high for their revenue which is a result of the structuring of pharmaceutical drug development pipelines. And using this observation I was able to construct some basic drivers for the income statement to improve the business over 5 years. This would include a 10% YOY (year over year) increase in revenues. Furthermore, Gilead will support R&D costs and SG&A costs as a result of their acquisition to help decrease those abnormally high numbers. Thus resulting in a basic 5 year projection shown below:

Gross Margins are WIP and 26% Tax Rate is standard for C corp.
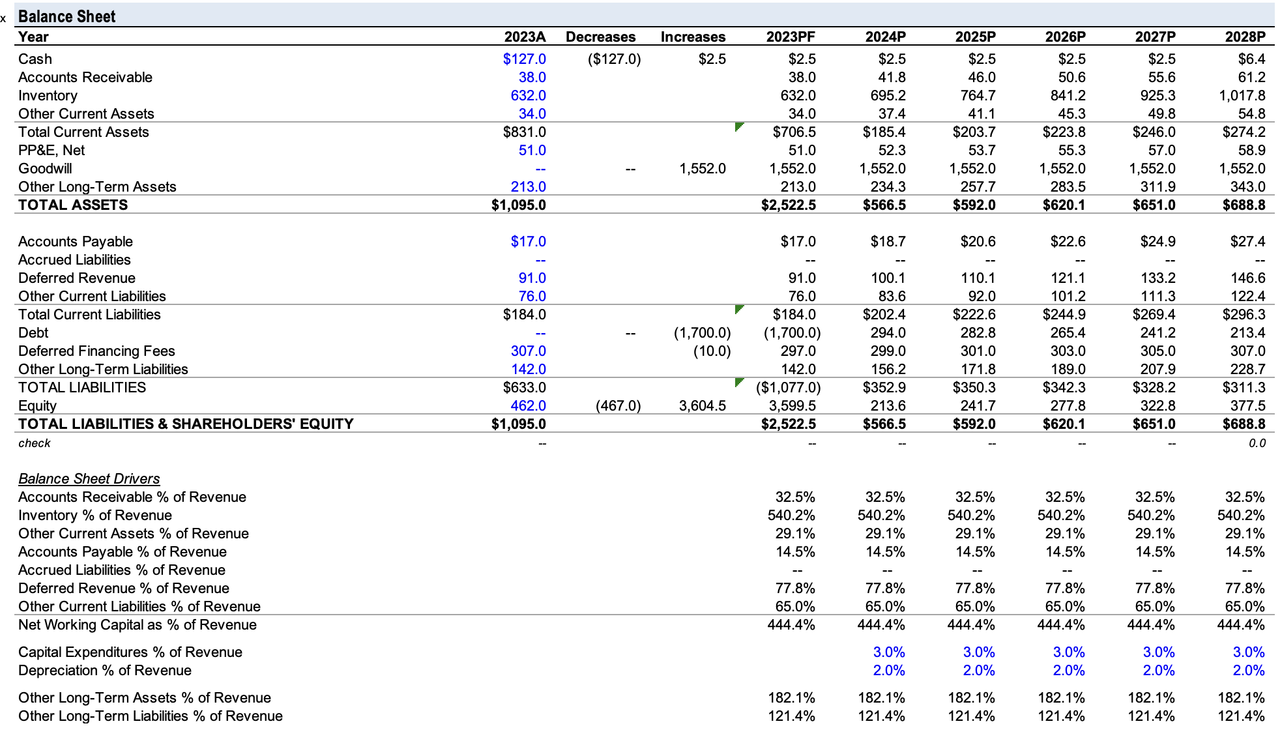
In a similar fashion I replicated balance sheet values and began working on drivers as shown below:

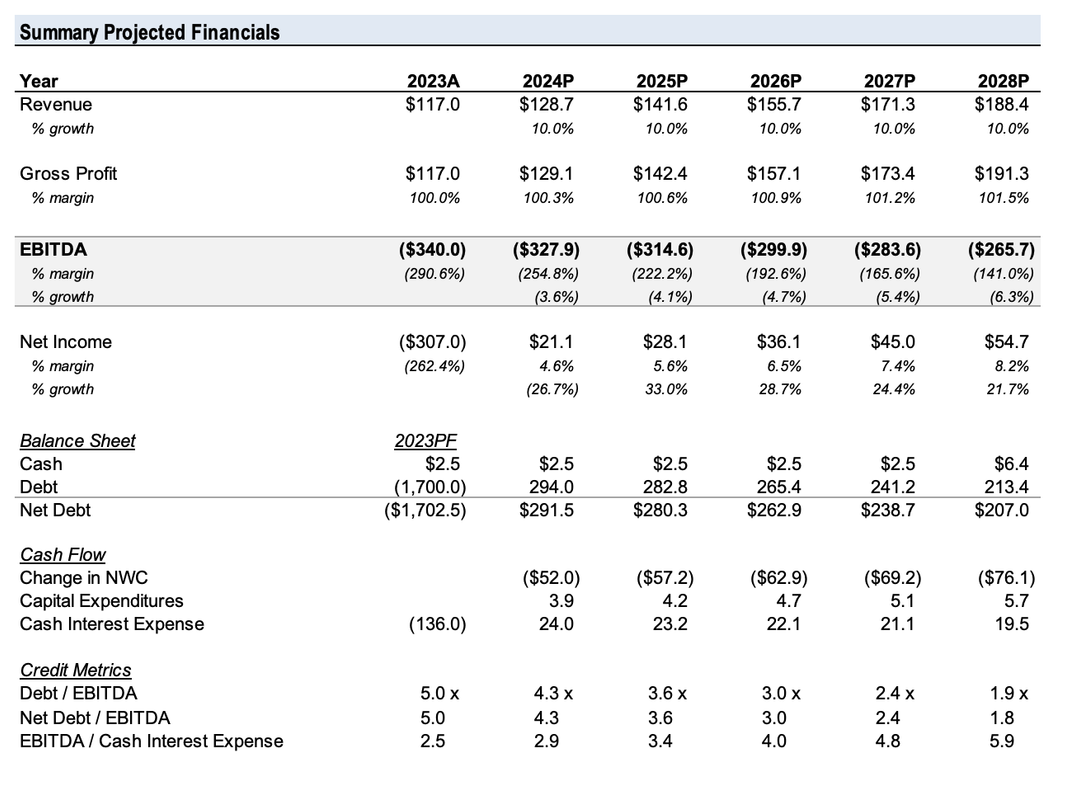
I also constructed a summarize 5 year projection chart (shown below) to help guide me as I work on the full model, and while many of the values are still work in progress, the highlight is the 5 year EBITDA projections which were previously increasing, but are now decreasing as we implemented our own drivers for the income statement. Essentially the growth of the business will stand on decreasing that number and making it as close as possible to zero since it is negative and very high right now.

I will work more on the full model next week. Stay tuned for the next edition of my blog!

Leave a Reply
You must be logged in to post a comment.