Week 7 - Analyzing Results pt. 1
May 13, 2025
Welcome back to my blog! So far, everything I’ve done has led up to finding the energy spectrum (the eigenvalues) of my system. Now, I will be using the energy spectrum to extract as much insight from my models as possible. In this post, I will be talking about the partition function.
Partition Function
One of the most powerful tools for connecting quantum energy levels to thermodynamics is the partition function. It allows us to calculate quantities like average energy, heat capacity, and more. In statistical mechanics, the partition function is defined as:

, where E_i are the energy eigenvalues, T is the temperature, and kB is Boltzmann’s constant. This formula weighs each energy level according to how “thermally accessible” it is; low-energy states contribute more at low temperatures. In my model, I’ve scaled the temperature so that kB*T is expressed in units of hopping energy t. Recall that the elements of the Hamiltonian matrix are also in units of t, so I had to ensure the units matched. The probability of being in a particular microstate i is simply

Analysis
Once we have Z(T), we can compute the average energy, as well as the heat capacity. I will, however, be talking about these in the next blog post. For now, I will investigate the variation of Z(T) with respect to the iteration of the Sierpinski triangle, setting my temperature as a constant value.

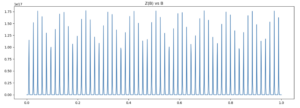
In this graph, we see that the presence of a magnetic field gives the partition function slightly larger values than in the uniform model. Generally, this indicates that the nonuniform system has more thermally accessible states than the uniform model (essentially, more freedom). Now, an interesting result occurs when I consider how Z varies with magnetic field B in the nonuniform case. It turns out that the variation is extremely sensitive, so much so that it is difficult to determine a genuine relationship between the two. Essentially, depending on the number of data points you choose to graph, you might include some important information, but lose a lot of other details. Unfortunately, due to shortage of time, I have not determined the proper method of analyzing this data. In the meantime, here is a graph that may or may not have any meaning at all:
In the next post, I will be applying the partition function to calculate more practical quantities.
Leave a Reply
You must be logged in to post a comment.