Week 8: Revising and Re-running the Entire Pipeline
April 25, 2025
Hi everyone! Thanks for tuning in to my Senior Project. This week, I brought together my analysis steps into a coherent pipeline and re-ran my phosphoproteome data analysis code with revised parameters.
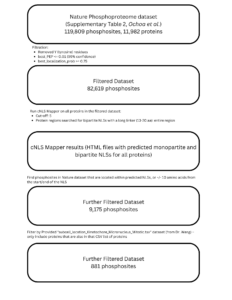
Before diving into code this week, I wanted to visualize my algorithmic approach in the form of a flowchart. This flowchart summarizes my methodology with relevant intermediate statistics (see Figure 1). Building this chart was very useful – it helped me keep the analysis steps clear in my head and also communicate my research work, as the goal of my project is not only to produce results for the lab’s specific research area but to create a generalizable method that researchers can customize to their needs (when it comes to analyzing phosphosproteome data for clinical relevance). I will include this flowchart (or a more sophisticated version) in my final research poster.
After meeting with my mentor with the flowchart in hand, he made some comments on how I can revise the workflow. While in the past weeks, I implemented this workflow as a proof-of-concept with preliminary parameters, he suggested that I make certain modifications: for example, including tyrosine phosphosite residues, lowering the threshold for best localization probability of phosphosites, and decreasing the cut-off score for NLSs to 4.0. So, this week, after modularizing and organizing my Python functions, as well as making them more interpretable with commenting (I often overlook this important aspect of programming…), I re-ran the workflow from the beginning: from filtering the Nature dataset to running cNLS mapper to parsing HTML results to finding SNPs. As my dataset now has 20,000+ phosphosites (located within 4,500+ genes), it is taking a long time to retrieve genomic and SNPs data (the code is still running). I tried parallelizing the code – sending multiple web requests at once using threads – but it is still slow, and I am experiencing some challenges with this, as the server keeps crashing. Hopefully, I will be able to share the results early next week.
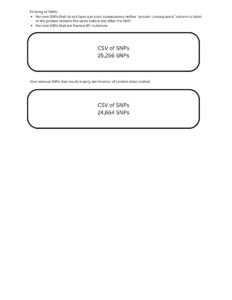
Furthermore, I decided to break up the SNP analysis into three branches, which is something I did not do last time. This time, I am checking for SNPs in three categories, which will help us rank them by importance: SNPs that correspond with phosphosite locations, SNPs located in phosphosite flanking sequences, and SNPs located in NLSs. By the end of the week, I obtained some results (SNPs in phosphosite flanking sequences), which I shared with my mentor. Specifically, I found 7 SNPs (missense and 1 deletion) located in these regions that are likely pathogenic (classified using established bioinformatic tools). The genes these phosphosites are located within are H1-4, SASH1, PNPO, YARS1, ATXN7, and SPAST. This narrowed-down list of SNPs is important because computationally, I have demonstrated that they are clinically relevant. As the next step, we can create a plan to test them in vitro to confirm our hypotheses. As I finish running the aforementioned revised workflow (with less stringent parameters) and obtain SNPs results, I will similarly interpret the results biologically.
Thanks!
Figure 1

Leave a Reply
You must be logged in to post a comment.