Week 10 Blog Post
May 11, 2025
Hi everybody!
Welcome to the last and final week of my senior project blog! It’s been a great journey and I hope you’ve learned something from any of my blogs. Today, I wanted to end off with a summary of my final product, as well as some final remarks.
The Product
Before we get into the product, let’s quickly review the goals of the project:
- Program a portable system to identify radioactive isotopes present in the surrounding environment.
- Increase nuclear science awareness.
In terms of goal 1, I wrote code (original python files and modifying existing files written by members of the lab) to analyze gamma spectra. I’ve covered the specific details of this process in pretty high detail in the Nuclear Physics Weekly sections of previous blogs so I’ll keep it brief here. In short, the program reads the spectral data from the Cesium Iodide sensor, looks for peaks in the data, then matches those peaks to different isotopes. After the program has a list of isotopes and the number of counts detected per isotope, it calculates the relative abundances of each isotope and plots them on a bar chart.
Here’s an example photo:
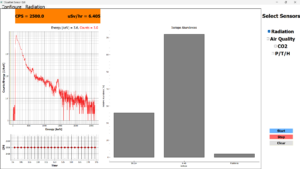
On the left is the radioactive spectrum, which is a generally downward sloping curve with a few peaks. On the right is a bar chart showing the relative abundances of each radioactive isotope detected. As expected, Potassium 40 and Bismuth 214 are the most abundant isotopes, with some positrons being detected due to Carbon-14 beta decays.
As for goal 2, I sincerely hope that you all learned something from my blogs. Nuclear physics is an amazing and important field that unfortunately has many misconceptions surrounding it. Through my nuclear physics weekly, I hope that I was able to dispel some myths surrounding the subject, as well as educate with facts about radiation and dose.
I furthermore believe that the portable system running my program can help in nuclear science education. Seeing spectrum and the relative abundances in real time is a great hands-on way to introduce students to radioactive decay and gamma spectroscopy, showing them the relations between features on a graph and radioactive decays.
And that ends my senior project! I hope that everybody reading my blogs learned something! I will be presenting at the BIF senior project symposium on 5/17, if you want to learn more or see the product in person.
Signing out,
Justin
Leave a Reply
You must be logged in to post a comment.