Week 9: Lesson Revamped and Loss Rendered
May 2, 2026
Welcome back to Week 9 of my Senior Project! This week continues the cycle of revisions as I now incorporate teacher feedback.
Revisions
I’ve heard back from a couple of teachers, and a common observation was that the lesson quality seemed to weaken as the course progressed. This makes sense because these past revisions focused mostly on the earlier lessons, and that’s where most of the feedback has been concentrated in peer testing, since those were the lessons encountered first. This actually aligns with my original plan, since I intended to revise the course sequentially to ensure a smooth progression so that each lesson flows well into the next.
So, following the feedback, this week, I began revising the “Neural Network” lesson. However, I quickly realized that the lesson needed to be entirely overhauled. I was revising the course in sequential order, so a change in one lesson meant rippling effects on all subsequent lessons. This kept building up until, now, the original “Neural Network” lesson is too far removed from the rest of the course. The bulk of the substance remained the same, but the style in which it’s introduced needed to be revamped completely, so I found it easier to start writing the lesson from scratch, while occasionally taking references from the original. Unfortunately, the lesson is not in a finished state if you’re reading this right when this is published. It will be out by the start of next week.
I also decided to cut the “Data Linearization” lesson because it proved to be redundant, as it wasn’t referenced at all in later lessons.
Another concern I had was that both peer testing and teacher feedback had the people going through the course in a single sitting. Because of this, the feedback might not reflect the experiences of learners who take breaks between lessons, who might not exactly remember how to access certain tools needed for the Desmos Implementation. I hope this is mitigated by the inclusion of the walkthrough videos I created last week, but I also decided to add a few redundancies within the lessons to remind the learner.
Progress
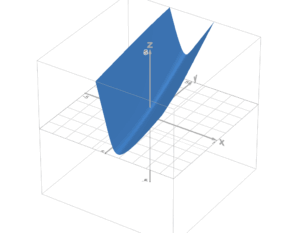
When I was revising the “Logistic Regression and Classification” lesson last week, I wanted to further explain why Log Loss was preferred over Mean Squared Error for the Loss function of a Logistic Regression. From my research, it appears that this was because the Loss function using Mean Squared Error wasn’t concave, so it would usually prematurely stop at a local minimum rather than the absolute minimum. However, I realized that none of those sources showed an actual graph of the function. Of course, for Logistic Regression of multiple inputs, the Loss function cannot be completely graphed because in our 3D world, we can only graph expressions of at most 3 variables, in the directions x, y, and z. But for Logistic Regression of a single input, with the Loss function consisting of just two variables, it can.
And now, we can see that while the Loss function of a Linear Regression is concave
But it’s quite flat for the Loss function of a Logistic Regression
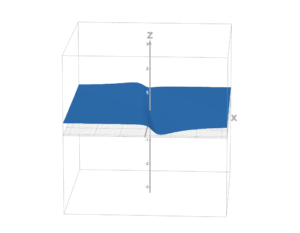
This isn’t optimal since the method of Gradient Descent, which we use to find the minimum value of a function, becomes very slow when the slope is close to 0.
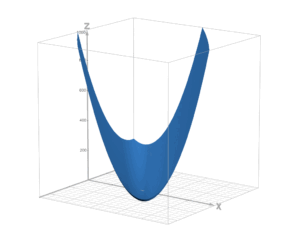
So instead, we use Log Loss because it’s concave for Logistic Regression.I do admit that this tangent I’ve gone down was part of the reason why the revamp to the “Neural Network” lesson was delayed, but I’m extremely happy with how this turned out, especially considering its absence in other machine learning courses.
That’s all for this week! Looking forward, I plan to send this course to a couple more teachers for their feedback, but with the end of the course coming soon, that might not be possible. Still, any feedback is appreciated, so if you want to give feedback or have anything clarified, please leave it in the comments.
Leave a Reply
You must be logged in to post a comment.