Week 5: Finalizations and a Foundation
March 31, 2026
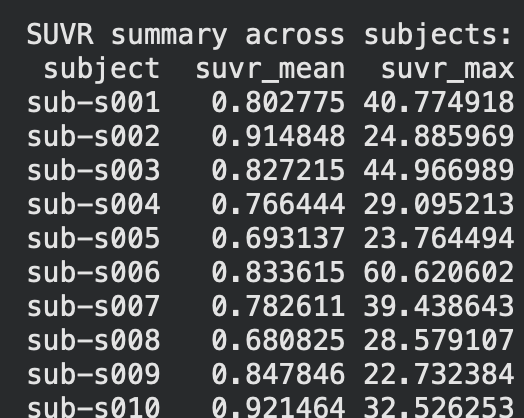
Hi all! This week, I finally finished gathering and finalizing datasets and began on making the processing pipeline for the different datasets that I will be using to both train and test the model on. Specifically, I was able to finish the foundation of the control dataset processing pipeline and generate graphs and statistics to compare the other two datasets(ALD and CTE) to. The specific statistics used here were SUVR(Standardized Uptake Value Ratio), which, put simply, means the concentration of tau protein within a certain area. The results are as follows below on the left(first ten subjects only).
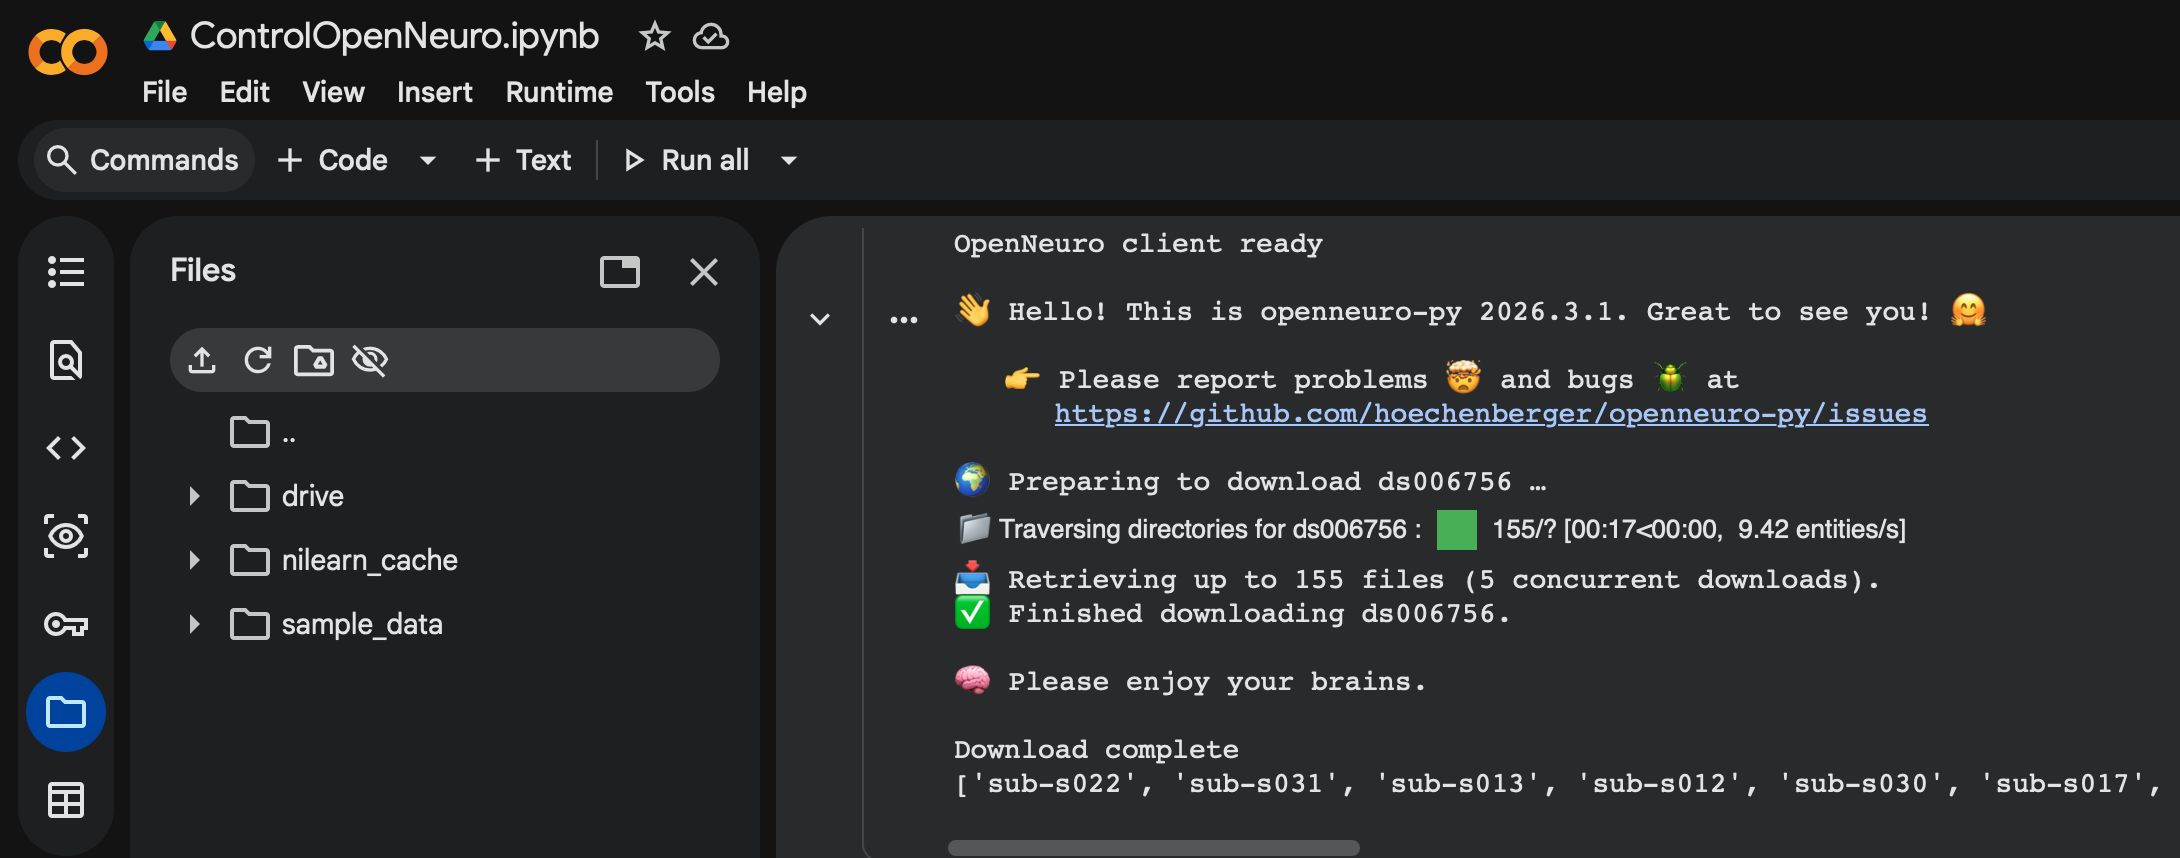
So how exactly did I establish the groundwork for this pipeline? The control dataset I used for the base was ds006756 from OpenNeuro, which consists of 33 patients with normal, young individuals with healthy tau distribution across their brain. This served as a great control, and the fact that it was from OpenNeuro helped even further as they have a specific API within Google Colab that allows my pipeline to be directly integrated with their datasets. This means that no manual download is needed, and that datasets can be downloaded and processed simply by coding a cell using the API. This is great as it allows for new datasets to be processed and integrated seamlessly within the entire ML model, often needing only one more cell of code to download and process it.(Shown below)
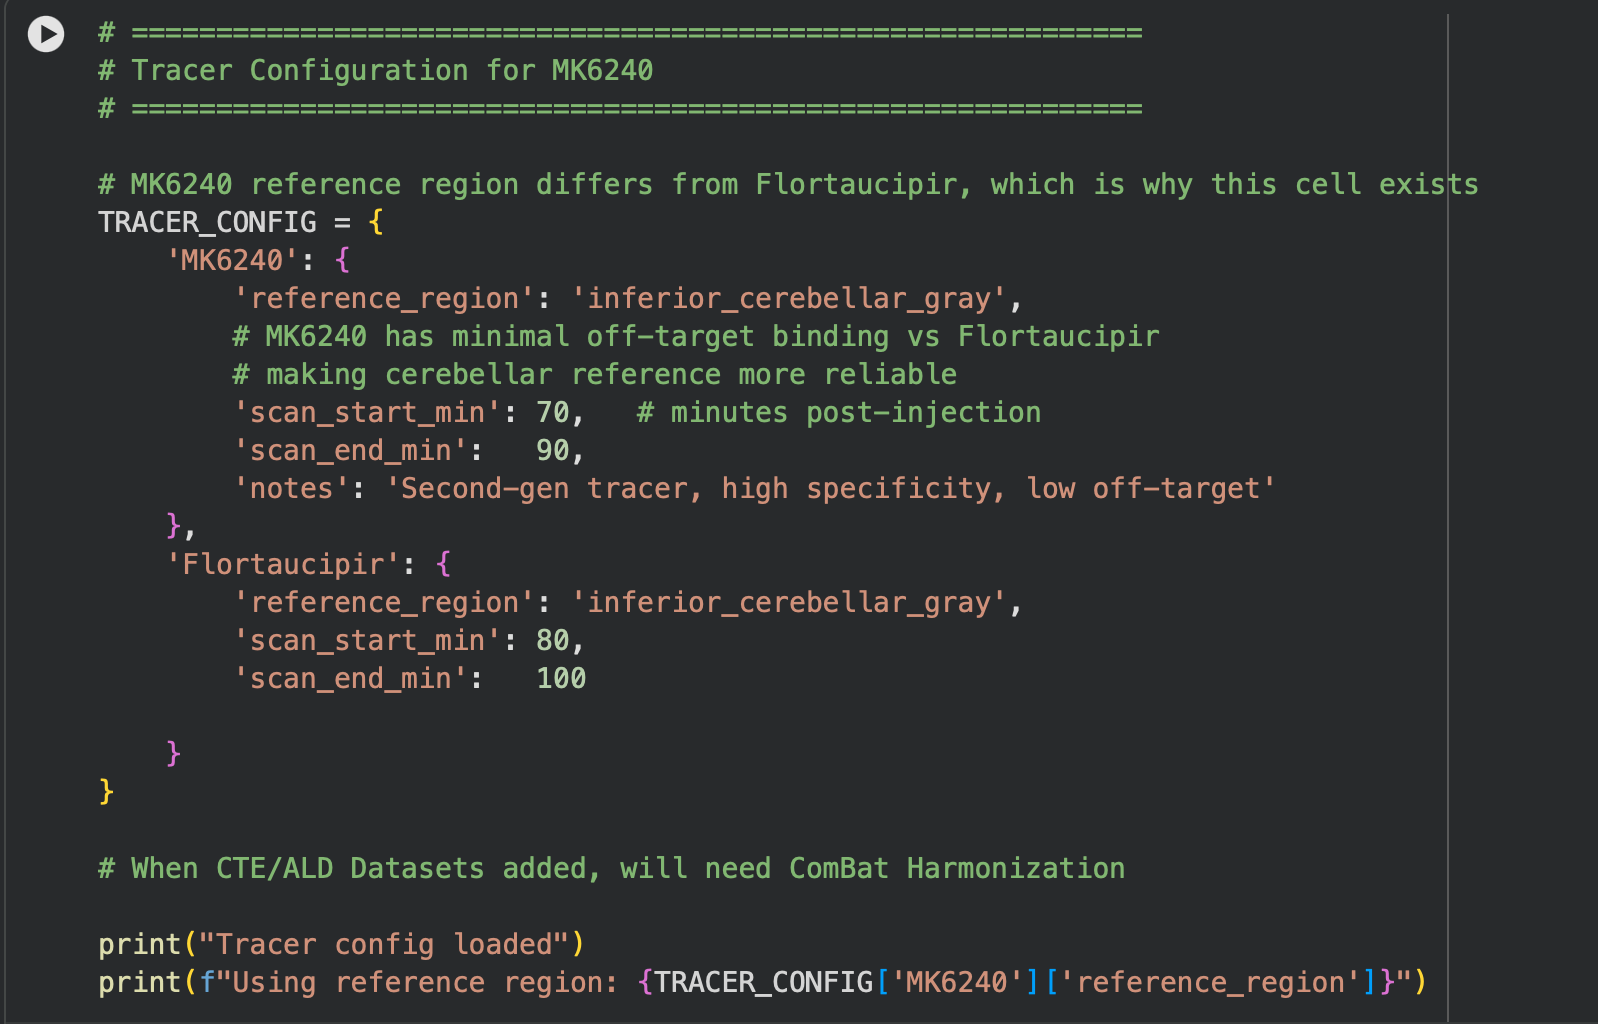
As for the actual flow of the pipeline, it is made up of 5 main cells. The first cell handles imports and installs for the actual software we use(OpenNeuro Downloader, NumPy, etc). The second cell involves a tracer configuration/converter, as some datasets use the MK6240 tracer, which needs to be standardized back to the most common tracer(Flortaucipir). This is shown below.
In cell three, I established session folders(these folders are created since the CoLab session is reset after you close the application) and provide a summary of all subjects within the session(this will soon involve more than just the control). Then in the fourth cell, we process each subject and calculate SUVR and ROI(Regions of Interest) means, as well as any other important statistics, and export them to those session folders created in the previous cell. Lastly, in the fifth cell, we extract and convert our findings into boxplots, as depicted below.

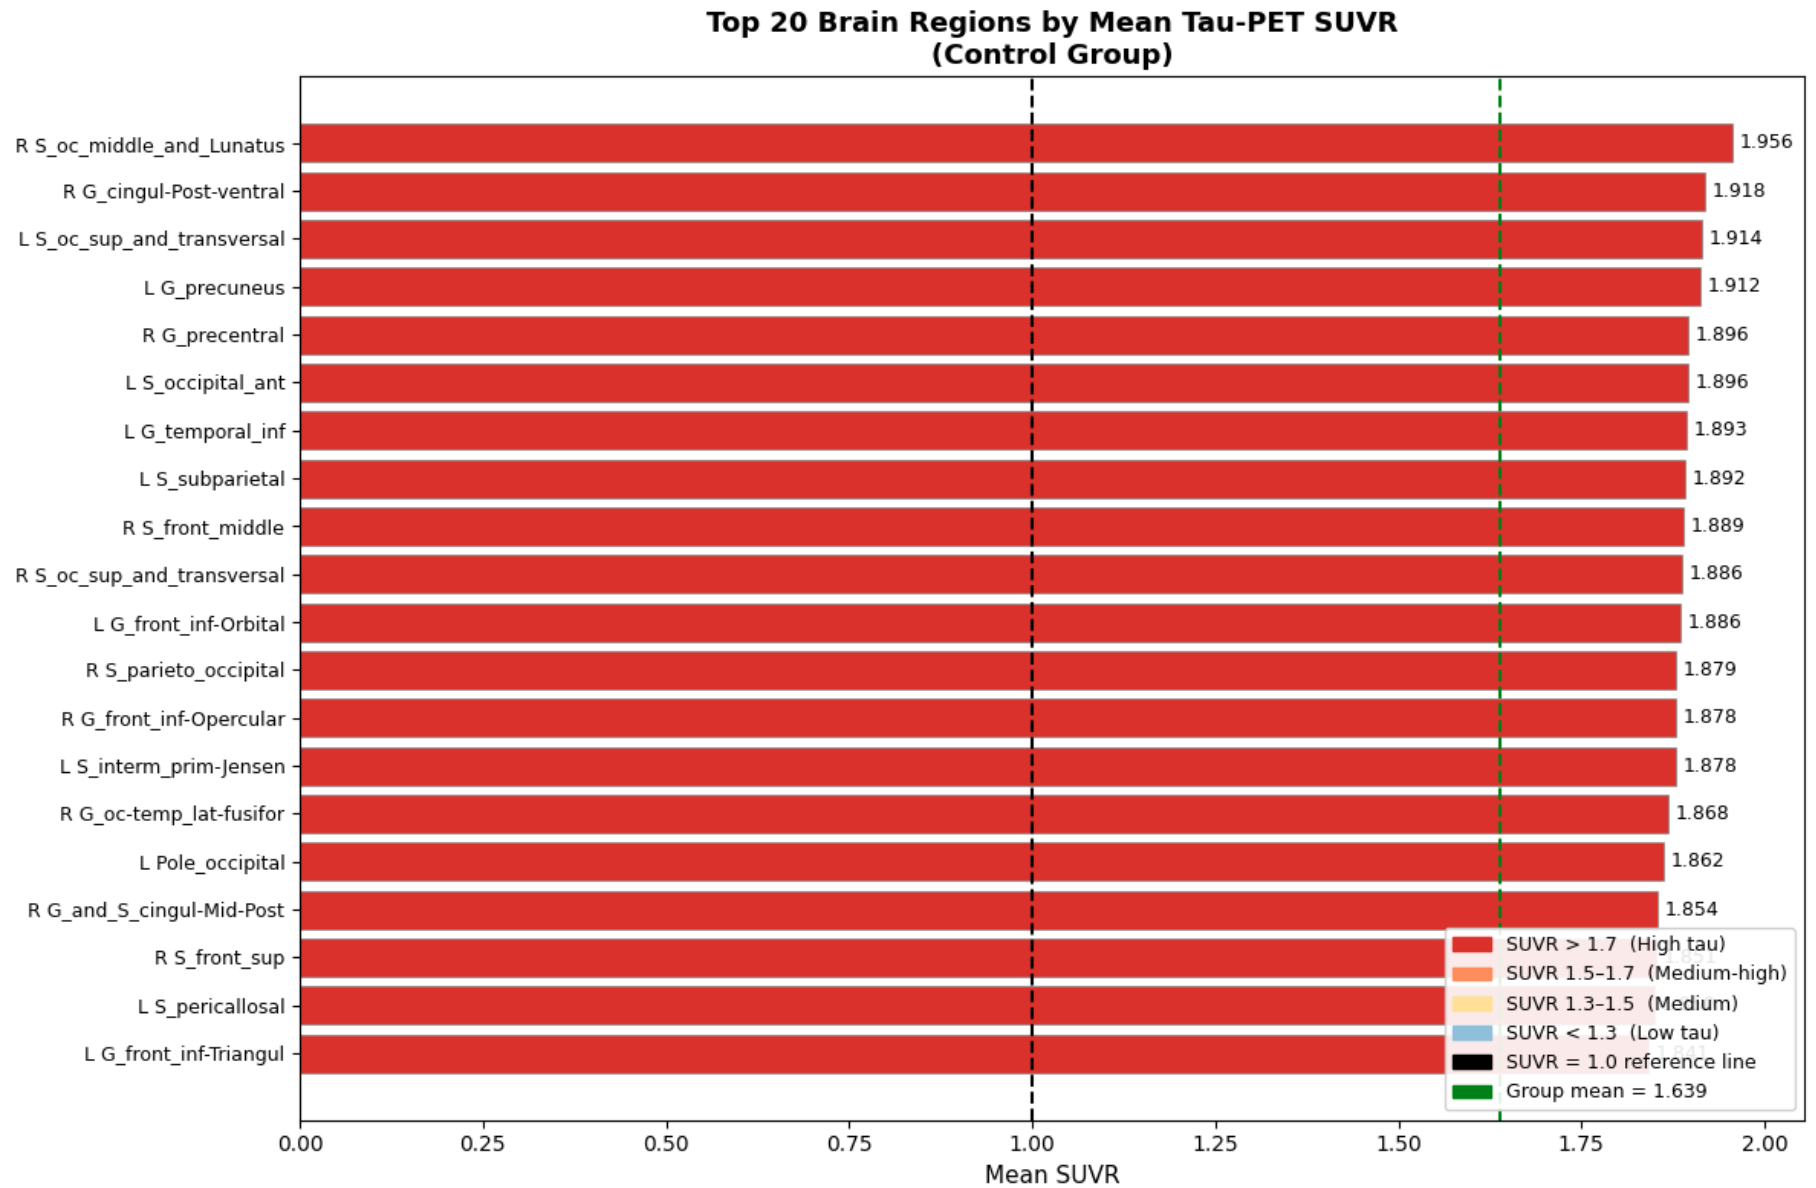
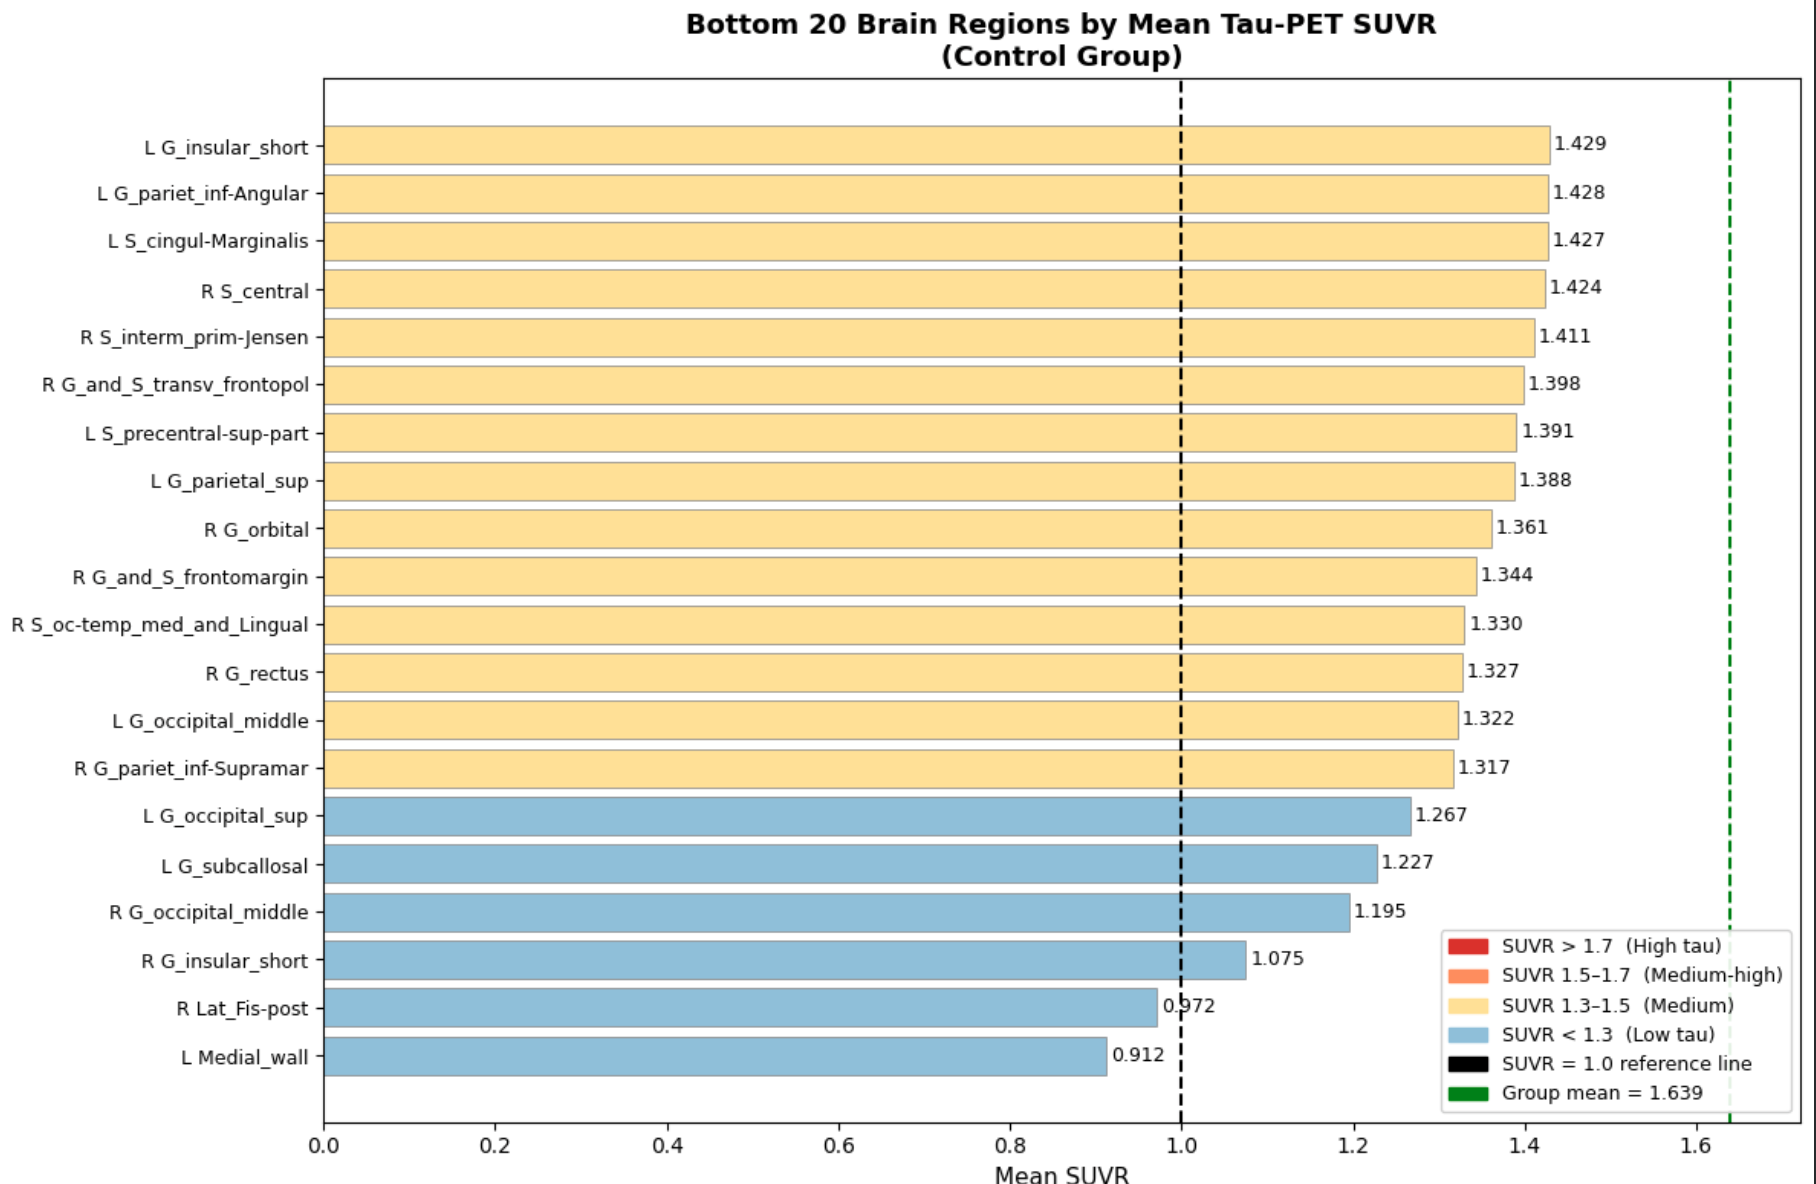
The biggest finding, which is also very crucial to this project, was the unevenness of tau concentration within healthy individuals. This is crucial for the project as now we have a baseline to compare datasets of unhealthy tau buildup, and truly note any tauopathic disease traits that might be present within the test scans as compared to general unevenness. In the next few weeks, I will continue to expand this pipeline into a multi-dataset, fully-functioning, and accurate ML model. Until next time!
Reader Interactions
Comments
Leave a Reply
You must be logged in to post a comment.
Hello Aditya,
This looks quite interesting and progress sounds nice! However, I have 1 question. Is there a concern that 33 people is a low sample size?
Hi Chris,
Thanks for your question. As a whole, 33 as a sample size is indeed low, which is why I intend to continue finding datasets to increase the sample size. I chose to only use a few datasets to build the foundation, and the rest will be applied once everything is confirmed to be extracting values and working correctly.
Hi Aditya, great blog post! I especially love how you included images of the process along the way—they made everything very easy to follow along with. I’m also working with analyzing data so it feels so relatable 😅 Good luck with the rest of your project!