Week 6: The Cerebellar Mask Issue
April 9, 2026
This week, I addressed a problem and troubleshooted the pipeline in order to have it ready for the last step of creating a foundational ML model. The core problem was in the get_cerebellar_mask() function in the preprocessing pipeline. It was designed to identify the inferior cerebellum as a reference region for computing SUVR (Standardized Uptake Value Ratio), but it had a fundamental flaw in how it calculated MNI z-coordinates.
The original code was:
mni_z = affine[2, 2] * zi + affine[2, 3]
if mni_z < -40:
mask[:, :, zi] = 1
This simplified calculation only used two elements of the affine matrix’s third row, which is only correct when the image is perfectly aligned to MNI axes. However, for most datasets, they are not standardized perfectly. This produced an incorrect cerebellar reference region, and in some cases a completely empty one. This is shown in the below output in the control datasets, where SUVR is far from the “1.0 standard.”
First 5 values: [1.23617827 1.72605648 2.31010386 1.44630158 1.26450816]
The consequence was that when I moved to the ADNI dataset and compared your control SUVRs to the AD group, the control SUVR values came out unusually high (1.6–1.9 across most regions), when healthy young adults should be close to 1.0.
The PET scans were being resampled into native T1w space (the subject’s own anatomy) rather than into MNI152 standard space first. The solution to this was:
- Resample PET -> MNI152 first (using load_mni152_template from nilearn), then apply the z-coordinate mask
- Use a proper cerebellar atlas mask file in MNI space, resampled to each subject’s volume, rather than a hard-coded z-cutoff
The results were as follows:
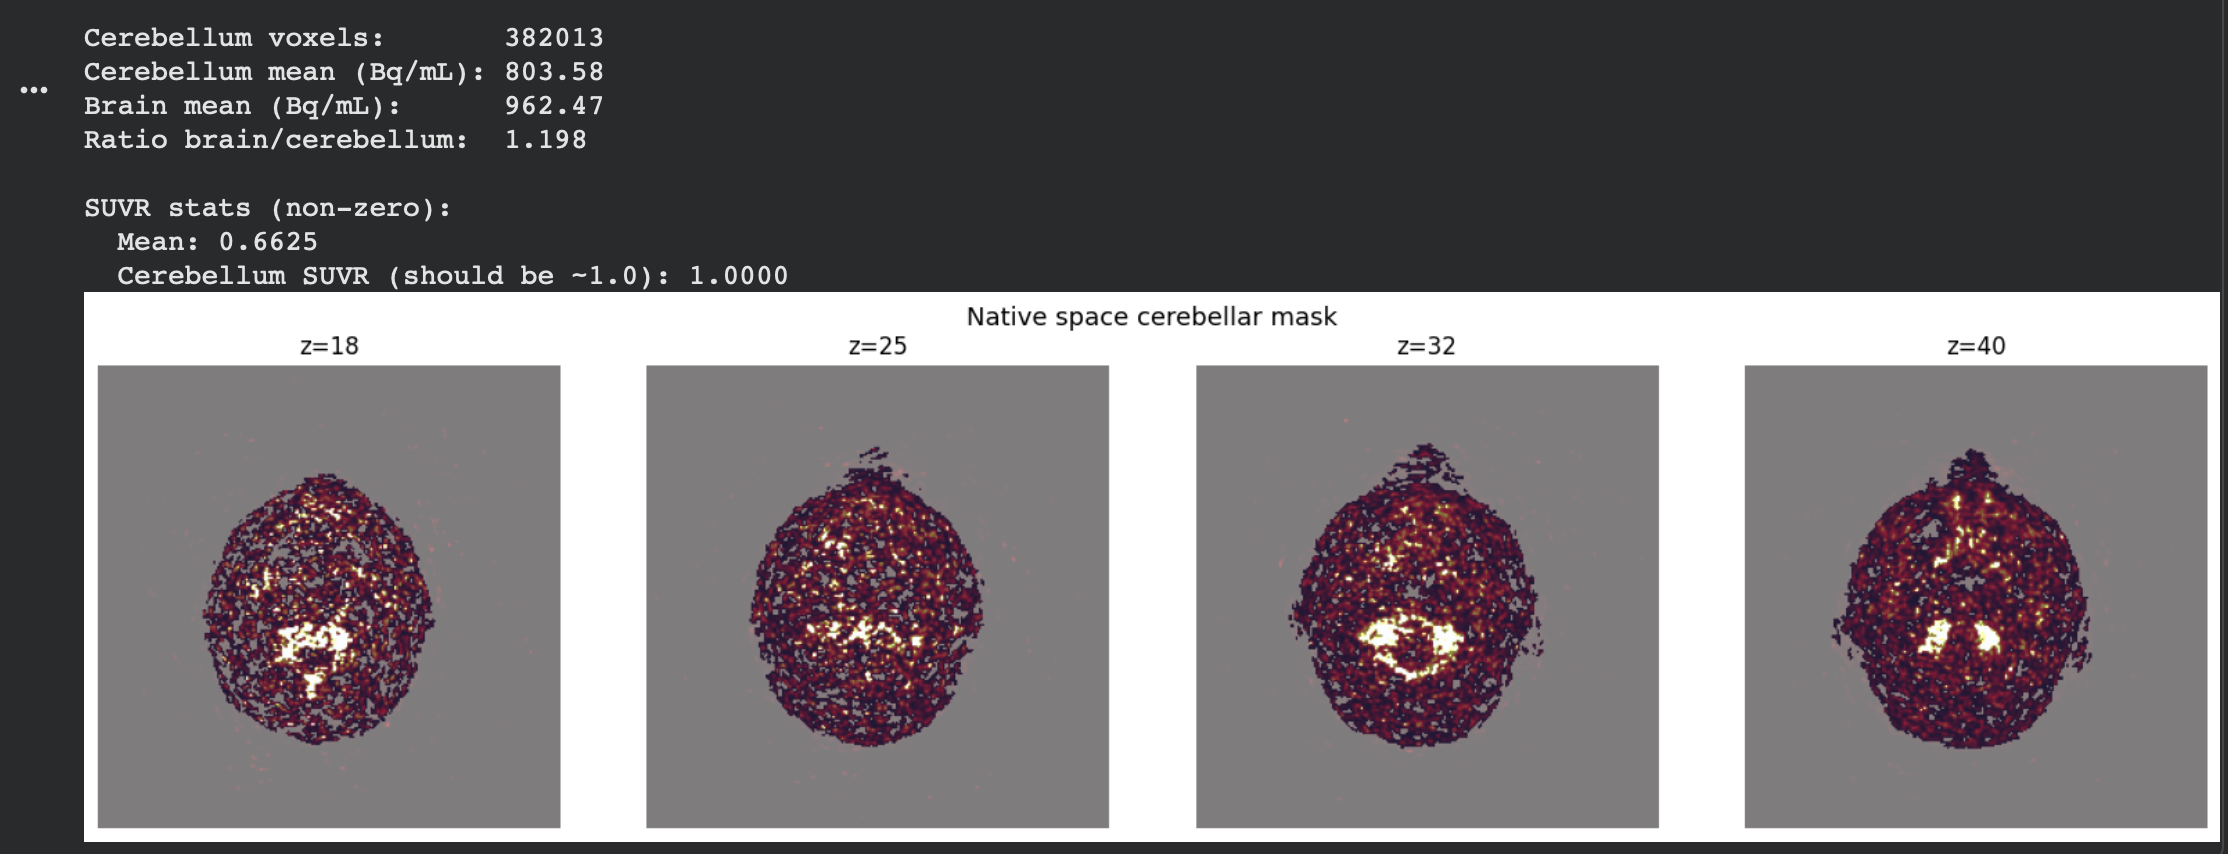
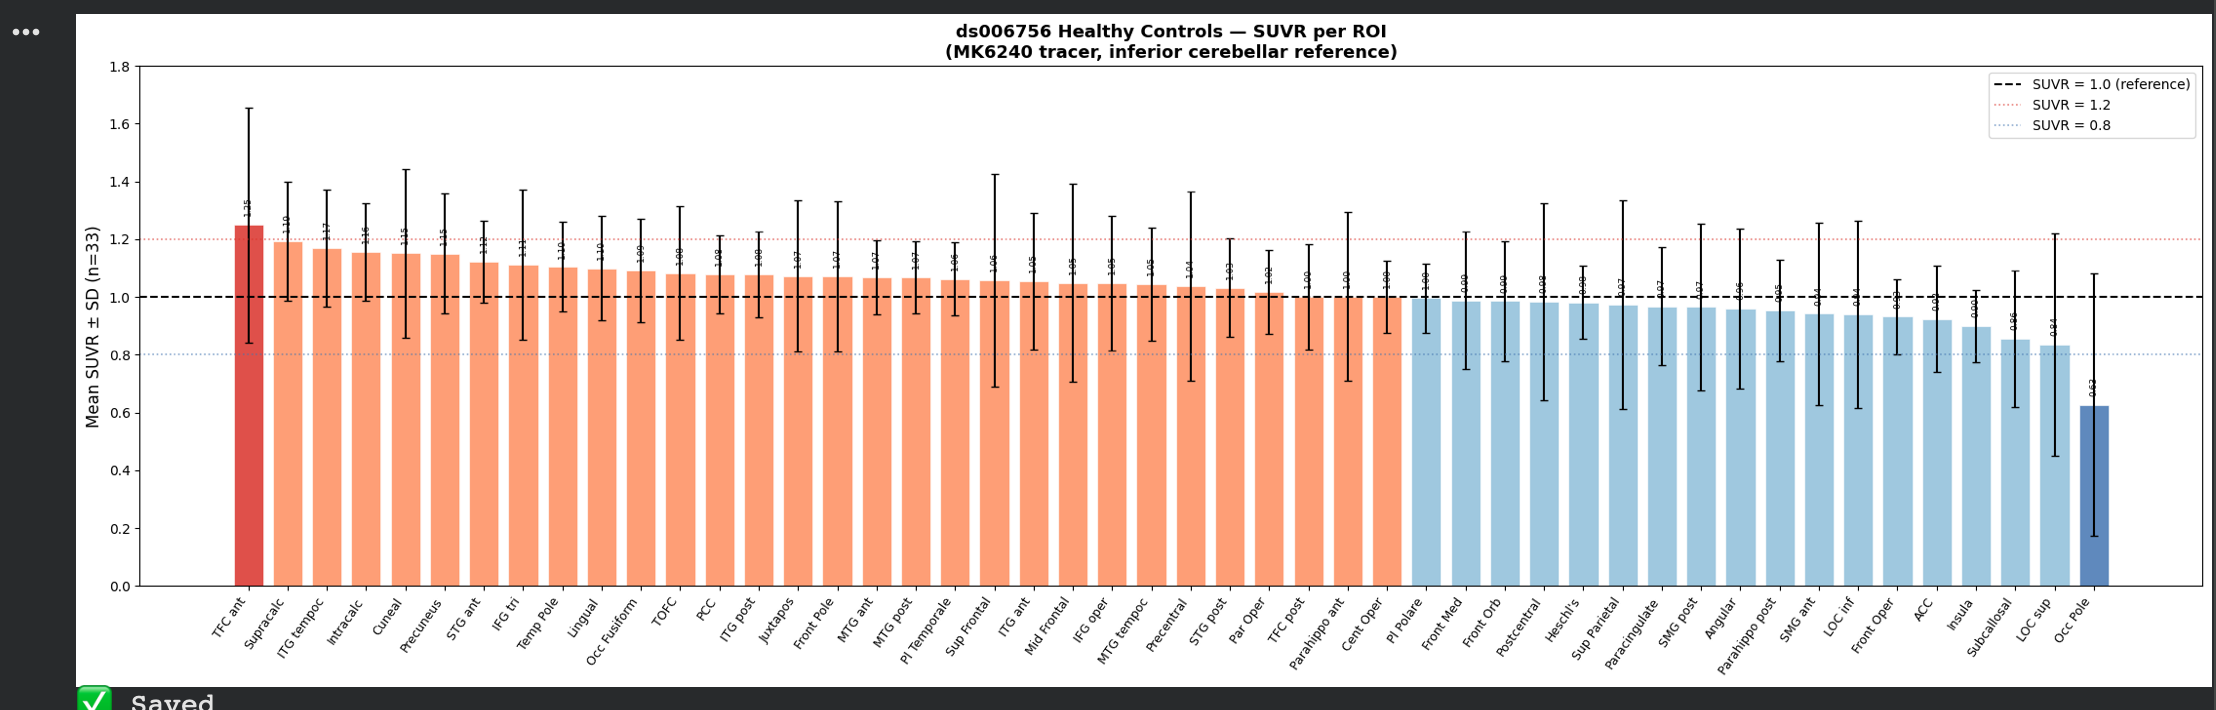
The values were much more stable now, and ready to be compared against the control. I then extracted the same SUVR-ROI values from the ADNI dataset(which contains tau-PET scans of those diagnosed with ALD), which led to the resulting data.
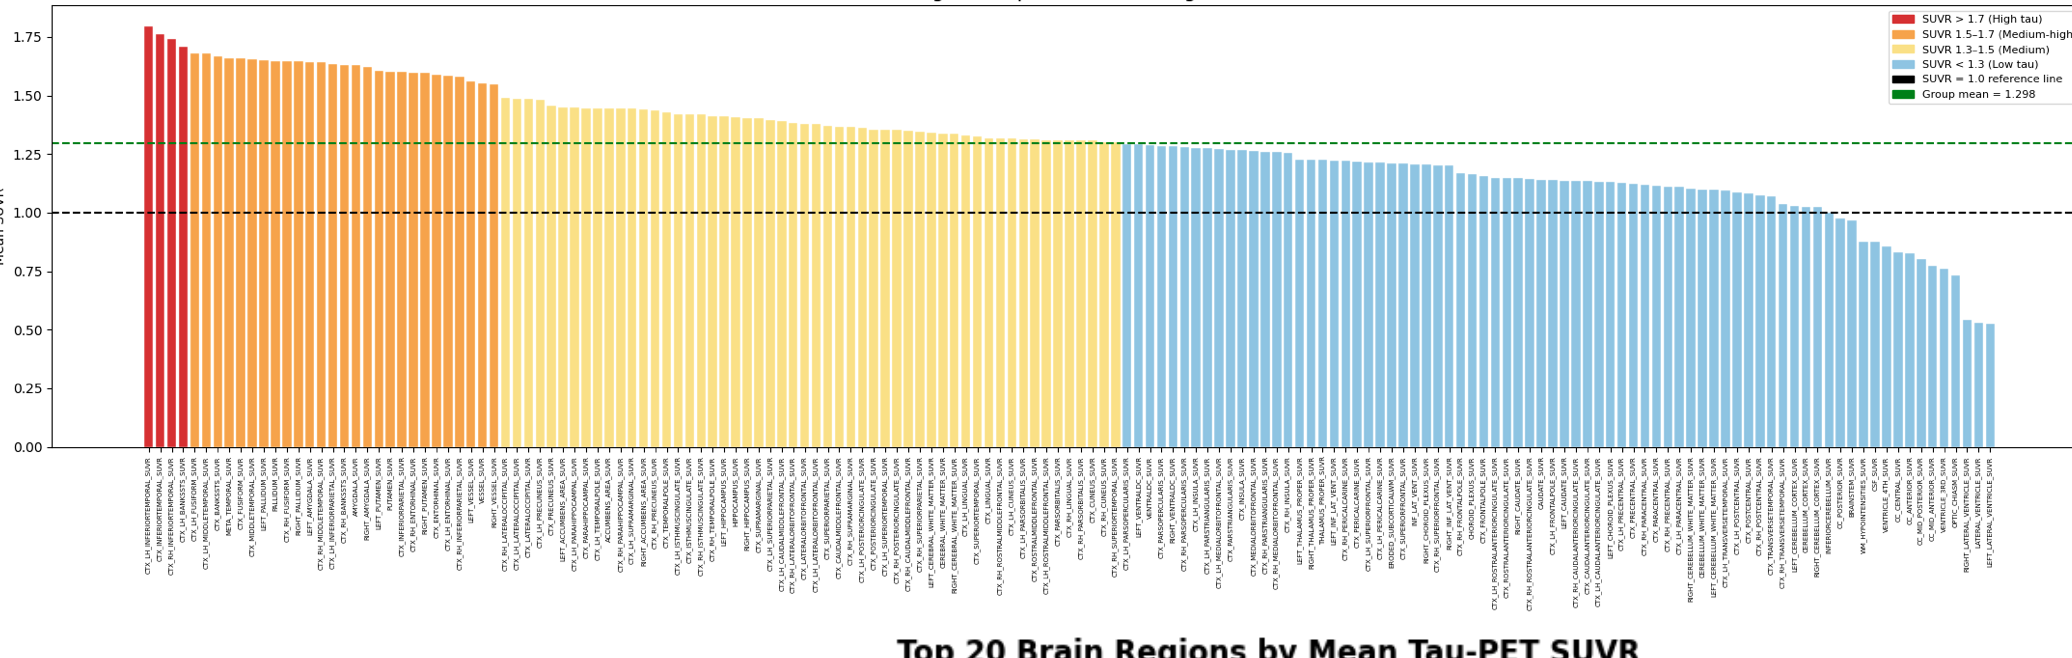
This indicates that the model is properly extracting those values given the raw data, as it is much more skewed than the control group. All that is left is to expand the number of datasets within the pipeline, which I intend to do within the next coming weeks.
Reader Interactions
Comments
Leave a Reply
You must be logged in to post a comment.
Looks like you’re really putting that ML course you completed to good use! Thanks for giving us a look of a zoomed in view of where your project is at and shows how challenging certain aspects of data analysis can be. Just using the two different datasets requires careful calibration in order to compare directly.
Hi Aditya, WOW! Love the progress you’re making and the results you’re getting; it all looks so interesting! Good luck with expanding the number of datasets you’re going to analyze in the following weeks. I’m excited to see what comes out of it!