10: Results Breakdown
May 20, 2026
The following is an analysis of my results.
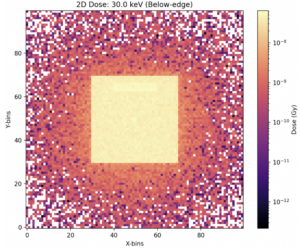
Two-dimensional dose heatmaps generated from the Monte Carlo simulations revealed clear differences between the 30.0 keV and 33.2 keV beam energies. In both simulations, dose deposition patterns generally followed the geometric structure of the phantom. However, the most significant differences appeared within the iodine-filled tumor region.
At 30.0 keV, dose deposition within the tumor region remained only moderately elevated relative to surrounding tissue. Although iodine attenuation was still present below the K-edge threshold, the enhancement was comparatively weak and exhibited limited contrast separation from nearby anatomical structures.
In contrast, the 33.2 keV simulation demonstrated substantially stronger localized dose deposition within the iodine-filled tumor. The enhancement appeared spatially confined to the tumor boundaries and produced a visibly brighter region within the heatmap compared to the surrounding tissue background. This increase is consistent with the abrupt rise in photoelectric absorption that occurs when photon energy reaches the iodine K-edge.
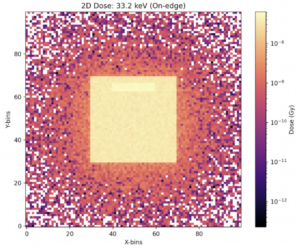
Representative heatmaps for both beam energies are shown above. The enhanced localization observed at 33.2 keV suggests that monochromatic beams tuned to the iodine K-edge can selectively amplify attenuation within iodine-containing structures while preserving comparatively stable background tissue response.
Below is a side by side comparison of the two, highlighting the difference between the two heatmaps:
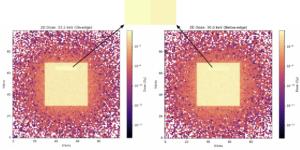
Outside the tumor region, surrounding soft tissue and lung regions exhibited relatively small differences between the two beam energies.
To quantitatively examine localized attenuation behavior, one-dimensional line profiles were examined. These profiles provided spatial comparisons of dose deposition as a function of position for both beam energies.
The stronger peak observed in the 33.2 keV run, at the coordinate of the tumor, indicates increased photoelectric interaction probability within iodine at the K-edge energy. Because the surrounding tissue profile remained comparatively unchanged, the relative tumor-to-background contrast increased significantly under K-edge conditions.
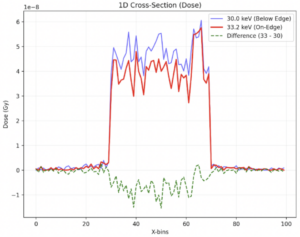
The above image presents the extracted line profiles for both beam energies. The enhanced peak localization observed in the on-K-edge simulation (notice where the lines intersect and switch positions) further supports the effectiveness of energy-selective monochromatic imaging for improving contrast-agent visibility. To put it simply, in the area of the tumor (where the lines intersect), the 33.2 keV beam caused the iodine-containing tumor to absorb radiation more strongly, showing that K-edge imaging conducted with a contrast agent and an ICS based beam could help imaging contrast.
These findings demonstrate the central advantage of K-edge imaging. Selective amplification of contrast agent upon imaging, without proportional increases in global tissue dose.
Leave a Reply
You must be logged in to post a comment.