Week 7: Running Examples
May 5, 2025
Welcome back to my blog! Today I’ll began playing around with S4. Recall Week 4, where I demonstrated S4 using an external extension on nano hub [1]. In the previous blog, I successfully built S4 from source, and today I’ll present its flexibility with some given examples.
Setting Up
Last blog, I compiled S4; now, I needed to setup some scripts to run. S4 has an easy to understand documentation page [2], requiring a minimal background of Lua. Within my project folder, I created a test folder called “scripts,” and within it I created my first script “firstTest.lua”. To run this script, I used “% ./S4 ../scripts/firstTest.lua.” Soon, I realized I needed a way to interpret the huge columns of numeric data.
I decided to implement a python script that would be capable of handling the data. Using matplotlib, I could generate images of my data. To streamline the process, I saved the printed output to a text file that could be immediately accessed by my Python script. With everything set up, now I can now demonstrate S4.
Examples
Within S4s GitHub, navigating to the “examples” folder reveals finished scripts that resemble already published results. I’ll take a look at a single example [3].
Since the code is already provided, I’ll just demonstrate S4s functionality without getting too technical.
For Liu (2009), I’ll run fig3c.lua and fig3d.lua. For the former, I copied and pasted the contents into firstTest.lua and ran the command “%./S4 ../scripts/firstTest.lua > /Users/aliu3203/PyCharmMiscProject/data.txt.” The code is already fully commented, so I won’t be going over each line. The plot of fig3c and fig3d generated by S4 looks like this.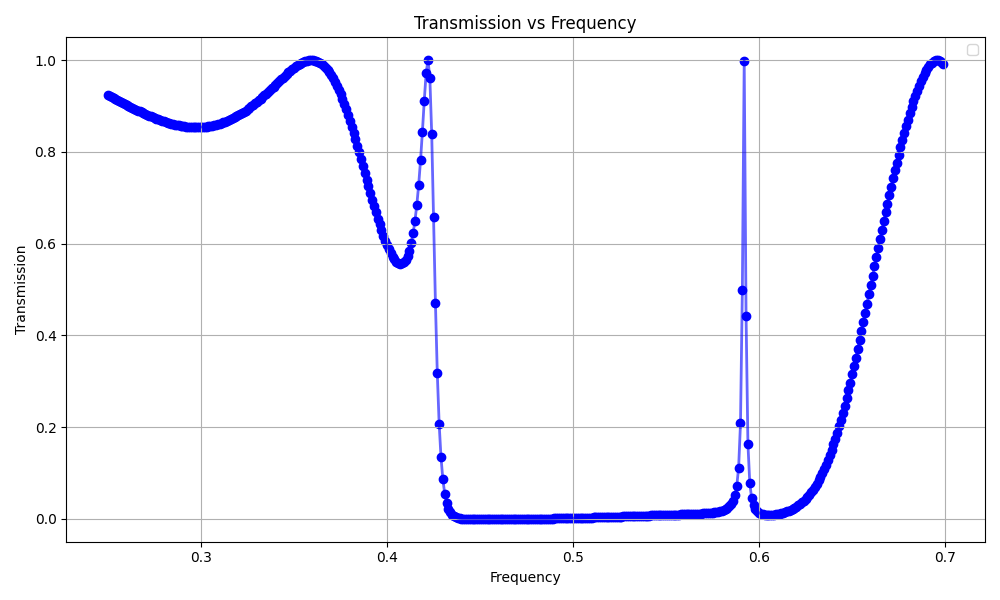

Referring to the paper, only fig3c seems to *kind of* resemble its original counterpart. It replicates the peak and valley behavior at around the same values of frequency. However, fig3d appears to be a little off. There’s a periodic pattern which is nice, but it isn’t the same as the paper.
Next blog, I’ll construct my own examples, and afterwards, I’ll attempt to construct a structure that behaves nonlinearly.
[1] Jiarui Kang, Xufeng Wang, Peter Bermel, Chang Liu (2014), “S4: Stanford Stratified Structure Solver,” https://nanohub.org/resources/s4sim. (DOI: 10.4231/D35T3G11T).
[2] Victor Liu and Shanhui Fan, “S4: A free electromagnetic solver for layered periodic structures,” Computer Physics Communications 183, 2233-2244 (2012) http://dx.doi.org/10.1016/j.cpc.2012.04.026. 2. Michael Ghebrebrhan, Peter Bermel, Yehuda Avniel, John D. Joannopoulos, Steven G. Johnson, “Global optimization of silicon photovoltaic cell front coatings”, Optics Express 17, 7505 (2009).
[3] Victor Liu, Michelle Povinelli, and Shanhui Fan, “Resonance-enhanced optical forces between coupled photonic crystal slabs,” Opt. Express 17, 21897-21909 (2009)
Leave a Reply
You must be logged in to post a comment.