Blog 9: Temperature dependence part 2
May 21, 2025
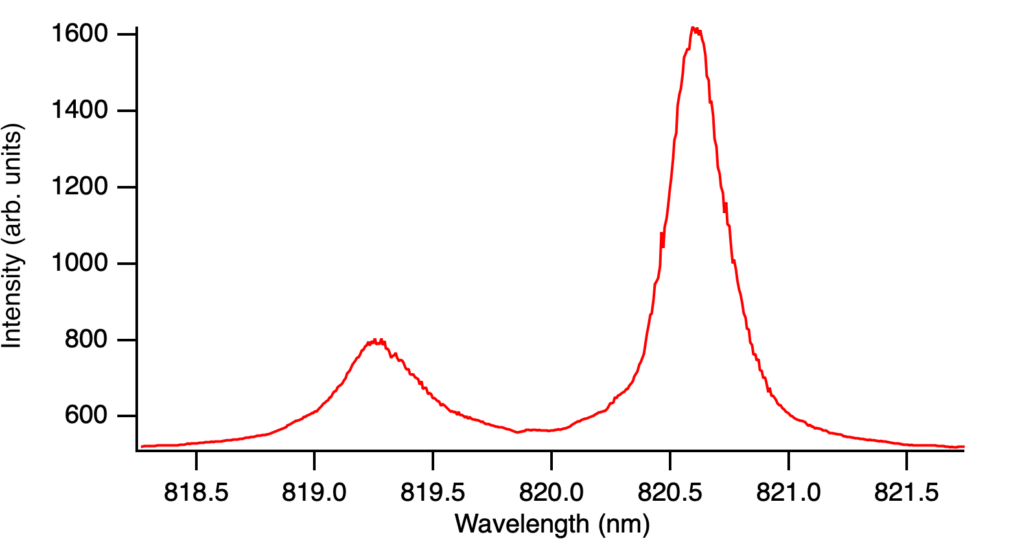
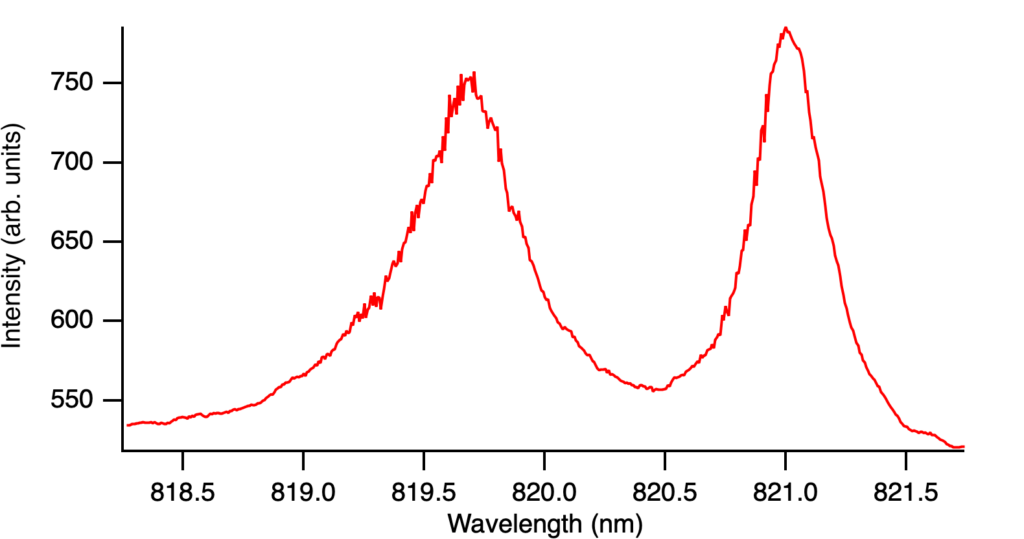
Welcome back! My teammates collected the temperature dependence with the HeNe laser when I was not there. I forgot to mention this last week, but I accidentally selected a different resolution on the spectrometer, meaning the range of wavelengths on the x-axis was smaller than when we got the data with the HeCd laser.
Because we don’t get much outside of the peaks, I thought it wouldn’t make much sense to apply a linear offset, and the slope I got was around 0.6 anyway. Before, it came from the AlGaAs peaks further to the left, but now I could not see the effects. I was in the middle of finding my fits when I noticed that this was not true for all the data.
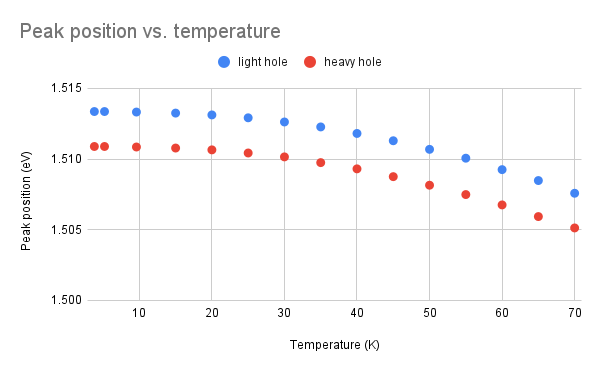
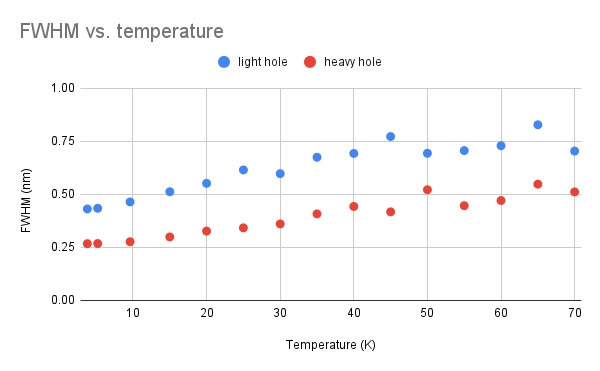
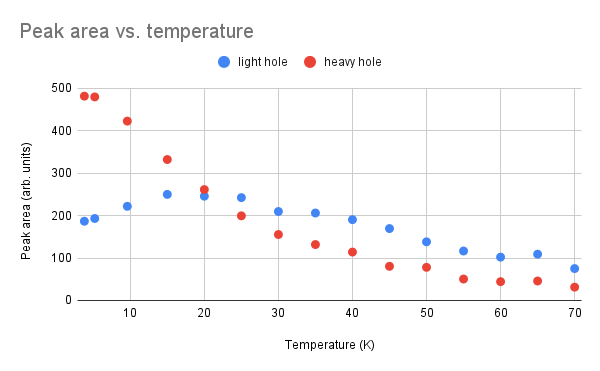
So, I decided to start over and apply the Lorentzian with a linear offset fit to everything. After I found all the fits, I plotted the same data for peak position, peak width, and peak area.
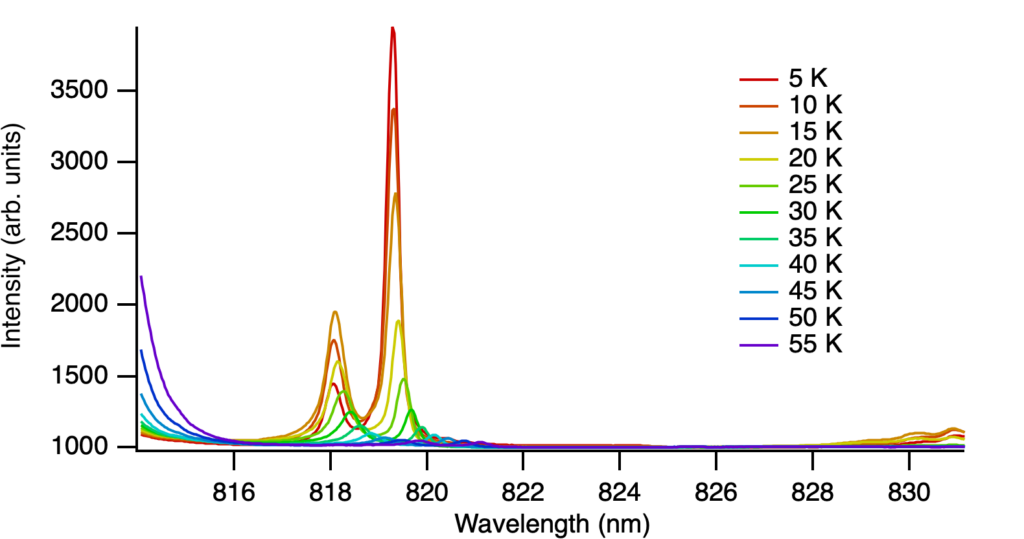
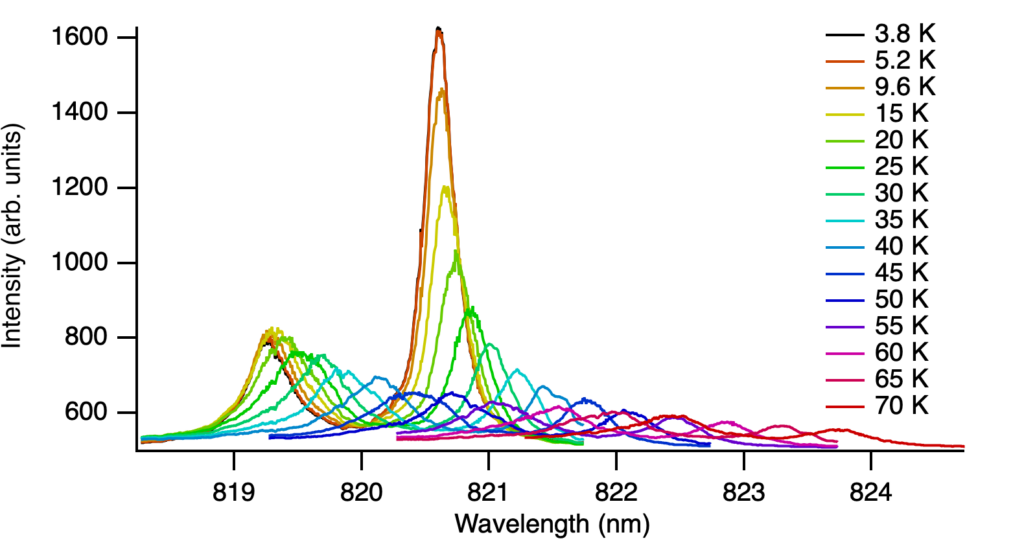
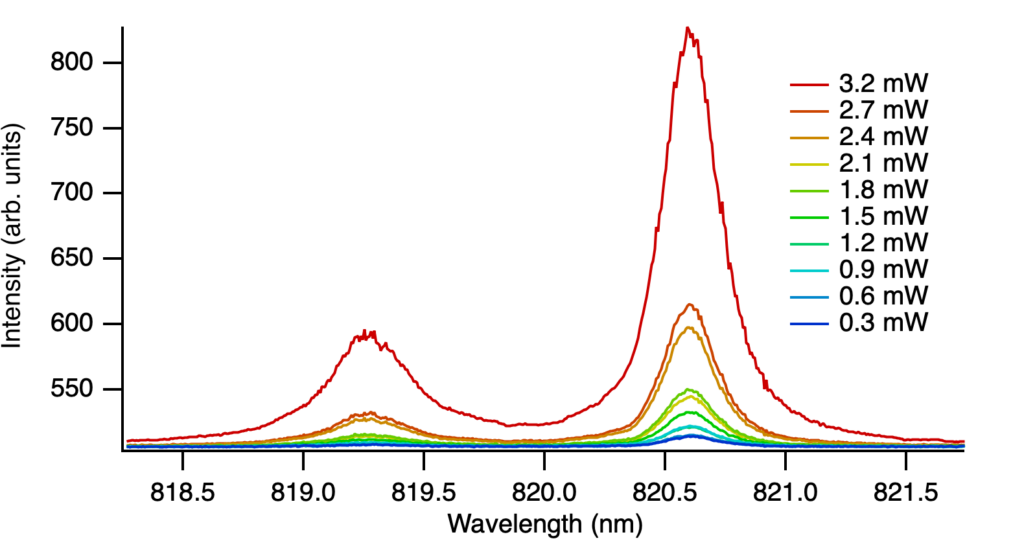
I started comparing my results from the HeCd laser and the HeNe and trying to analyze my results, but I’ll leave that until my next blog. I also figured out how to combine my PL spectra and add a legend, so I’ll end this blog with some rainbow graphs for the HeCd, HeNe, and laser power in order (I did the colors manually!).
Leave a Reply
You must be logged in to post a comment.