Week 8: Plotting the Patterns
April 22, 2026
Greetings, graph gurus! After weeks of collecting data from multiple sources, this week is where everything begins to come together visually. With datasets ranging from advertising airtime to search trends, social media activity, and sales figures, I’ve begun transforming raw data onto graphs to better understand the patterns behind them.
Visualizing the Data
Over the past week, I focused on organizing and graphing each dataset individually to observe how trends change over time. For each of my selected drugs, I created visual representations of advertising frequency (ads per month), Google search trends (searches per month), social media post frequency (Reddit posts per month), and sales data (annual sales across 2023 and 2024).
By plotting these variables, I’m able to begin identifying whether spikes in advertising align with increases in public interest or drug usage before I start aligning each dataset together.
Below is a brief overview of the data trends I’ve observed so far visualized on line graphs:
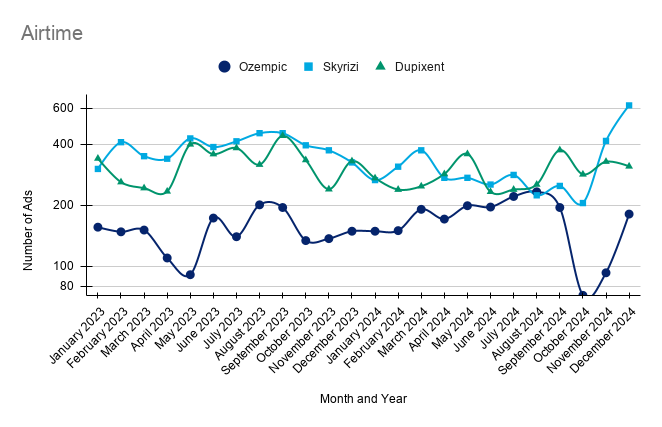
While I have not yet conducted formal statistical analysis and relayed these trends together on the same graphs, observing them separately already highlights a few interesting trends.
At a glance, the rate at which advertisements are aired do not particularly seem to be entirely aligned with social media post frequency and search frequency. While there are brief moments where the trends do align, further work in the coming weeks will help to decipher how accurate these alignments are.
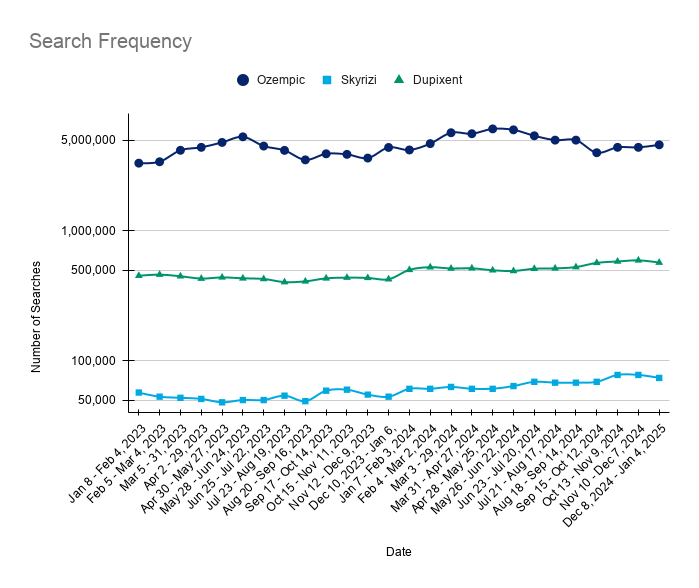
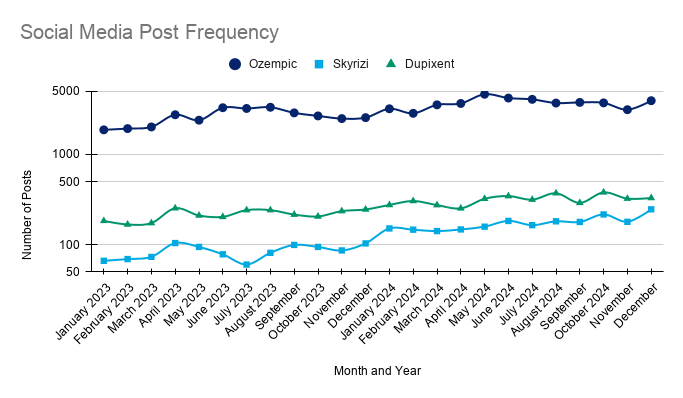
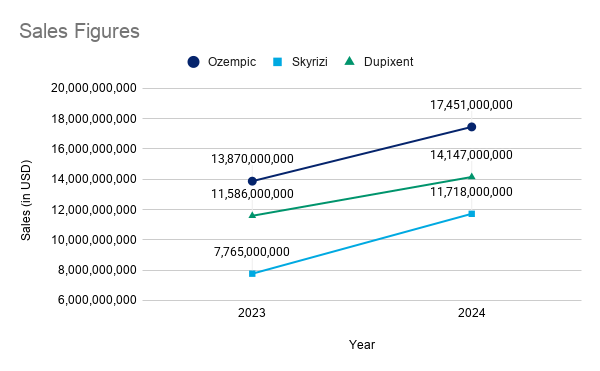
Ozempic consistently dominates across all datasets other than airtime. It shows the highest sales figures in both 2023 and 2024, as well as significantly higher search frequency and social media activity compared to SKYRIZI and DUPIXENT.
All three drugs additionally show growth from 2023 to 2024 in sales, search frequency, and social media post frequency. For search frequency, all drugs display a gradual upward trend over time rather than sharp changes. This suggests that public interest builds more steadily rather than reacting instantly to short-term changes in increases in advertisement airtime. Similarly, social media activity mirrors this gradual increase, mainly for DUPIXENT and SKYRIZI, which increases throughout 2024. Ozempic, while already quite high in post numbers, continues to fluctuate consistently, highlighting its strong online presence.
With the individual graphs now completed, my next steps involve integrating all datasets into combined visualizations, allowing me to directly compare advertising exposure with public awareness and sales in a single view. I will also begin conducting a statistical analysis to determine whether the patterns I’ve observe are statistically significant.
Leave a Reply
You must be logged in to post a comment.