Week 9: Creating Analysis Plots on the Syngap1 Mice
May 13, 2026
Hi everyone, welcome back to my blog once again! This week we were able to create lots of analysis plots on the Syngap1 and wild-type mice, building on the 4-hour data we segmented last week. These analysis plots include the progression of HFO (high-frequency oscillation) detections as postnatal age increases, a comparison of HFO detections between nortriptyline-treated wild-type mice versus nortriptyline-treated heterozygous (Syngap1) mice, and the progression of HFO detections across the different EEG channels. These plots were created through two new scripts called explore_classifications.py and explore_wt_het.py. I was also able to put together a CSV file that organizes the metadata of all the mice examined in the project.
After creating and running the 4-hour data we segmented last week without any errors, we wanted to truly summarize and examine the data for any significant patterns across the different types of HFO detections in all our mice. So initially, we created analysis plots of HFO detections by channel, starting with the EEG_1_SA-B channel and continuing on through the other three, and these channels specifically examined HFO detections in the heterozygous (Syngap1-affected) mice.
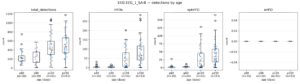
The image above displays one of many analysis plots for the different types of HFO detections across channels in the heterozygous mice. It breaks down four detection categories at each post-natal age bin (p60, p90, p120, and p150). The first panel shows total_detections, which represents every detection the pipeline picked up. The second shows pure HFOs, meaning ripples without spikes. The third shows spkHFO, which are spike-associated HFOs where an HFO co-occurs with an epileptic spike. The fourth shows eHFO, the epileptic HFOs. In this image, the plot shows a great progression of HFOs increasing as postnatal age increases, which is a good sign, since total detections, HFOs, and spkHFOs all roughly double from p60/p90 to p120/p150, with several high-end outliers appearing at p150. However, the eHFO panel is completely flat at zero across every age group, which immediately flagged a problem in the detection pipeline that I will return to in the next week section.
In one of my recent calls with my lab, I came to understand more about the impact of nortriptyline and its correlation to HFOs. Nortriptyline is originally an antidepressant, also commonly used to treat neurological chronic pain associated with conditions like Syngap1. But it doesn’t have a direct, one-way correlation to HFOs or epileptiform activity, since it can hypothetically push them up or down depending on context. Clinically, however, the broader pattern is that patients tend to have fewer seizures and progressively aren’t getting worse. Aside from this note, the general upward progression of all HFO types in the plots shows that epileptiform activity is occurring, and the drug is one of the tools we’re testing to potentially manage it.
On top of those types of analysis plots, we also created plots between heterozygous and wild-type mice to see whether there are variations or patterns among the HFO detections as postnatal age progresses.
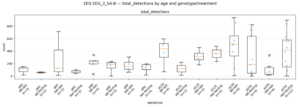
In this image above, here is one of the 50+ analysis plots we created to find significant variations and important data we could extract. However as we see in the image, in the analysis of HFO detections across different treatments in both heterozygous and wild-type mice, the HFO detections fluctuate quite a lot, not being able to give us a significant track or result to lead us now on the effects of the treatment or to test out the biomarkers. Some of this noise is likely due to small group sizes, since several post-natal dates have only n=2 or n=3, and part of it could be due to these models being trained on human data instead of mouse data, which may lead to variations. That said, a few patterns do stand out when zooming out, since Het-Nortrip at p150 with n=12 shows a wide spread with a fairly high median, suggesting nortriptyline-treated heterozygous mice still carry substantial epileptiform activity at older ages, while Wt-Veh (control with water) and Wt-Nortrip stay somewhat lower on average, though the small sample sizes make any firm conclusion premature.
With the new scripts explore_classifications.py and explore_wt_het.py that helped to create these plots, the scripts also produce classification summaries we can examine to improve the visualization of the EEG, and then from there, in the call, I was able to organize all of the metadata for the 54 mice in the project and add it into a CSV file that can be queried going forward. From there, we finally have some early results that show nortriptyline as having some effect on HFO detections in mice with the Syngap1 mutation, with specific HFO subtypes looking promising as biomarkers.
So for next week, as we saw in one of the images above, the epileptic HFOs (eHFOs) weren’t showing up as we ran the code and they are very important as a biomarker for epileptiform activity in all of the mice variants. So in next week’s blog, I will dive into how I fixed that bug so eHFOs would now be properly detected. Then, to find more patterns and biomarkers across these different treatments of mice, I will be segmenting and processing the 12 to 18 hour mark of the 24-hour EEG EDF recording files, so that we can analyze and detect the amount of HFO detections across the mice with much more detail and find proper, significant results and biomarkers! With deeper data and the eHFO pipeline fixed, we should finally examine the mice and impact of nortriptyline as a treatment even more for Syngap1.
Leave a Reply
You must be logged in to post a comment.