Week 9: Comparisons with National Data!
April 18, 2025
Hello again everyone!! Hope you all had a great week 🙂
This week I also did a lot of graphing and data analysis, but spent most of my time comparing my model’s classification to flu rates reported by large English-speaking countries to see how well my findings can represent (or even predict!) actual flu rates, which may open the door for epidemiologic applications of my approach.
Although Reddit doesn’t release precise geographic data, the user demographic by country is available online. According to the World Population Review, Reddit’s user base is dominated by users from the United States (42.95%), United Kingdom (5.46%), and Canada (5.01%) [1]. Although there is a huge gap between the United States and the other nations, the three nations together account for more than 50% of the Redditor user base. I decided to use these three nations to compare my findings to for the following reasons:
- They all have English as an official language. This is important because most posts on Reddit are in English, and thus the sample I took from Reddit is likely representative of these three countries (versus if the country didnt have English as an official language, people from the country may not post on Reddit to begin with and so Reddit is not representative of that country)
- All three are in the Northern Hemisphere. The graphs I created show patterns in flu rates that match up to the flu seasons in the Northern Hemisphere (October – March). I explored Australia’s flu trends, but since their flu season starts in April and ends around October, my Reddit sample did not match up well, making the information less useful for analysis.
- They make up the majority of Reddit users. Because these three countries collectively represent more than half of Reddit’s user base, it’s reasonable to assume that my Reddit sample most accurately reflects trends in these countries.
While this approach isn’t ideal for capturing worldwide flu trends, it was the most feasible given language, time, and resource limitations. A valuable next step for this project would be to expand the analysis to even more countries, including non-English-speaking countries using multilingual models or translated data.
To plot and make comparisons between my findings and national reports, I first collected flu rates reported every two weeks from national databases from September 29, 2024 to March 29, 2025 to cover the current flu season [2], [3], [4]. I made sure the start date of each two-week period aligned with the dates of my data, and plotted them together on a line graph:
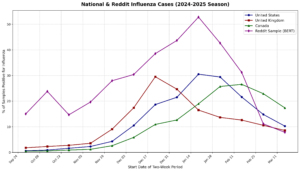
There were a couple of key observations that stood out to me initially:
- First, the flu rates estimated by my BERT model were consistently higher than those reported by national databases. This difference stems from the distinct sampling methods. National public health systems rely on lab tests from tens or hundreds of thousands of people each week, including many who test negative. In contrast, my dataset consisted of about 11,000 posts from specific sickness-related subreddits, where users are more likely to post only if they are experiencing symptoms or have already been diagnosed. As a result, my sample naturally skews toward higher flu positivity rates. This doesn’t mean my sample is unrepresentative of the general population; rather, it reflects a practical approach. Given my limited time and resources, it was far more feasible to focus on specific subreddits than to sample from all of Reddit.
- The general shape of the BERT line closely resembled that of the United States and Canada lines. While it is difficult to explain the resemblance to Canada, the resemblance to the United States is likely due to the fact that over 40% of Reddit users are from the United States.
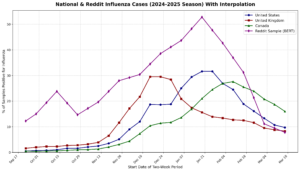
Because I applied my BERT model to every two-week period on Reddit, I also took national data of the average flu rate every two weeks. However, I was curious about the resemblance of the BERT curve to that of national rate graphs, so I interpolated weekly BERT values (taking average of the two weeks’ rates) and plotted them against the reported weekly flu rates. I found a similar pattern in the interpolated graph as well.
I thought the resemblance between the BERT line and US/Canada lines to be very interesting, and conducted correlational analysis to quantify how closely the lines matched up.
I first performed a basic Pearson correlation test on the graph without interpolation without adjusting for any possible time lag between the lines. The Pearson correlation coefficient for BERT vs. United States was 0.7599 (p-value = 0.0026) and was 0.3235 (p-value = 0.2810). Although correlation between BERT and United States rates was decently high, the time difference between the graphs negatively affected the correlation.
To address the time difference between the BERT data and actual flu case data, I repeated the analysis while adjusting for time lag (essentially looking at how well the data matches if there was no delay). After this adjustment, the correlation between BERT and U.S. flu cases was 0.9483, and between BERT and Canadian cases was 0.9534, indicating a very strong relationship between BERT’s patterns and that of national infection patterns.
Along with the time lag-adjusted patterns, I found that BERT’s patterns preceded real flu trends by 2 weeks in the U.S. and 4 weeks in Canada. Essentially, the patterns detected by BERT could be used to predict flu outbreaks up to 2 weeks in advance for the U.S. and 4 weeks for Canada during the 2024–2025 flu season with a high degree of confidence, which is significant for possible epidemiologic applications.
Because my model performed so well for the 2024-2025 season, I wanted also to gauge its performance for the past season as well to gauge its long-term reliability. However, the graph didn’t look as nice as before:

Clearly, the two peaks seem to be huge outliers and don’t fit in well with the national cases. Further, conducting the same time lab-adjusted Pearson correlational analysis produced a correlation coefficient of 0.8943 (time difference = 0) for BERT vs. United States and 0.8940 (time difference = 2 weeks behind) for BERT vs. Canada. We see that the graphs have neither a strong enough relationship, nor indicate that BERT patterns successfully predicted infection patterns in 2023-2024.
There are several factors that I theorize may play into this difference between the 2023-2024 and 2024-2025 graphs. For one, PRAW was able to collect far more posts for the 2024-2025 season than the 2023-2024 season, so the latter is more affected by outlying weeks. Additionally, the small selection of posts I picked to train my model skewed toward being from the past year, so the fit for past years’ data may not have been ideal.
That was a ton of new findings! But it’s been great to see my findings panning out like this. Next week I plan to wrap up graphs and analysis on the media concern end of my project by comparing my data to Google Trends data, formatting and making sure my graphs are nice and easy to view, and reading up some more to connect my findings to social psychology and explain my findings in such context.
Sources:
[1] https://worldpopulationreview.com/country-rankings/reddit-users-by-country
[2] https://www.cdc.gov/fluview/index.html (U.S. Flu Rates)
[3] https://www.gov.uk/government/statistics/national-flu-and-covid-19-surveillance-reports-2024-to-2025-season (UK Flu Rates)
[4] https://health-infobase.canada.ca/respiratory-virus-surveillance/influenza.html#syndromic (Canada Flu Rates)
Reader Interactions
Comments
Leave a Reply
You must be logged in to post a comment.
Question from an Honors Bio student:
First Model Classifications: If you do end up finding a consistent pattern, do
you think this would also work on different social media platforms (BlueSky, threads)
especially since they are gaining a lot more traction? Additionally, do you think it would
be more or less accurate? I love the progress so far and I can’t wait to see what the
results are!
Question from a different Honors Bio student:
Is it possible to scrape the comments of posts as well to check if they voiced similar
concerns or anything relating to ILI?