Week 6: Evaluation Nation
April 3, 2026
Hello readers! Welcome to blog post number 6.
This week’s post is a continuation of last week’s. In week 5, I began the evaluation process by writing a script in Google Colab to read from my spreadsheet and score responses. Each time the script runs, it generates scores for all 140 model answers in that set based on one specific evaluation criterion. Because I am comparing two models across two evaluation dimensions, I needed to run the script four times:
- Evaluate the fine-tuned model’s answers for accuracy
- Evaluate the base model’s answers for accuracy
- Evaluate the fine-tuned model’s answers for instructional quality
- Evaluate the base model’s answers for instructional quality
Last week, I ran the script twice before realizing I forgot to include descriptions of each score (1-5) in the prompt to the LLM-as-a-judge. This week, I added this in and generated responses for all 4 categories. Since running the script takes several hours and there is a daily limit on how many requests I can send to the judging model, this was the bulk of my work this week.
I also realized this week that I planned to implement a control group. In the control, I will ask both models a set of questions unrelated to tabla and evaluate those answers as well. The expectation is that both models should perform equally well, since my fine-tuning dataset only contains information about tabla. In other words, the fine-tuned model should not be more knowledgeable than the base model on topics unrelated to tabla.
If both models receive similar scores on these unrelated questions, it will strengthen my results by showing that any differences in performance on tabla-related questions are likely caused by the fine-tuning process itself, which is exactly what my project aims to test.
I haven’t implemented this set of questions yet, so this will be my focus when I come back from spring break (week 8). I will also begin analyzing the scores. This will involve identifying patterns across different prompt categories and subcategories, and determining where each model performs best and worst. From there, I’ll be able to better understand how fine-tuning affects the model’s performance.
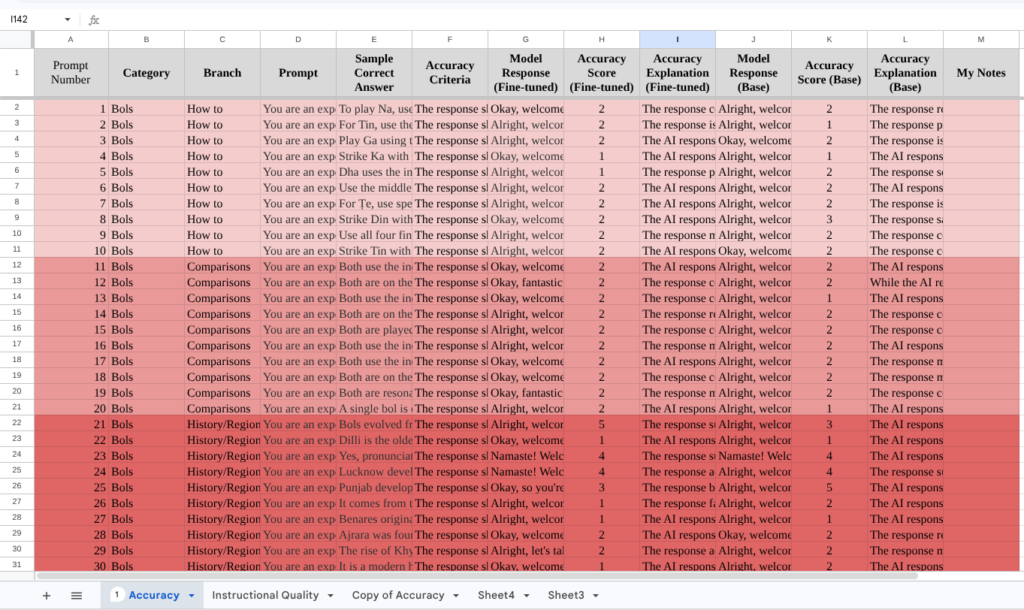
Below, I’ve attached some photos of my spreadsheet, which contains the responses from both models and the output generated from the evaluation process. Hopefully, taking a look at this can clear any doubts my readers may have about my methodology. The first screenshot is the accuracy evaluation, and the second is instructional quality. Note that in both, the prompts and responses stay constant.

Thank you all for reading! If you have any questions, please do leave a comment and I’ll get back to you as soon as I can.
Leave a Reply
You must be logged in to post a comment.