
Week 10: Three-Step Verification
May 1, 2026
Hello, lovely readers! We’re back for Week 10 of my senior project.
Last week, I ran a few tests to be sure the evaluation data I collected was as accurate as possible. I did three things:
- I ensured the temperature setting was the same across the base and fine-tuned models.
- I regenerated model responses that were more concise than before.
- I reached out to the two tabla students who’ve been guiding me through the musical part of the project.
This week, my goal was to analyze the impact of these changes. I’ll start with the first two.
After reevaluating responses generated under these controlled conditions, I found that the gap between the base and fine-tuned models became much smaller. In fact, both models earned an identical average accuracy score of 4.15 on the control group. This was an important result: it suggests that once variables like temperature and response length are standardized, the two models perform equally well on prompts outside my fine-tuning dataset. In other words, any differences I observe in the experimental group are much more likely to be due to fine-tuning itself, rather than inconsistencies in the testing setup. *sigh of relief*
As for the experimental group, the fine-tuned model had an average accuracy score of 3.01, and the base model scored 2.99. As I’ve mentioned before, it makes sense that the fine-tuned model would perform slightly better on material related to its training. However, I still need to determine whether this difference is statistically significant.
The third step I took last week, collecting insights from the tabla students, was fruitful in an unexpected way. I selected 10% of my prompts and asked the students to choose which model produced the more accurate response. My project uses LLM evaluation, but this step uses human evaluation. My goal was to see whether a human evaluator would agree with the LLM evaluation and whether a potential discrepancy would reveal flaws in my LLM evaluation process.
The results of talking to the students were split. Out of the 14 prompts I shared, the two students disagreed on the better response 5 times. For the remaining 9 prompts, they preferred the base model 5 times and the fine-tuned model 4 times.
This nearly 50-50 split shows me that, in the eyes of a tabla expert, there isn’t, honestly, much difference between the accuracy of the two models. It may seem like this isn’t a valuable insight, but it’s actually consistent with the LLM evaluation metrics I listed above (2.99 base, 3.01 finetuned). In other words, both human and AI evaluators seem to agree: the models perform very similarly in terms of accuracy.
With all this in mind, I spent a couple of days this week creating graphs to represent the LLM evaluation to use in my final paper and presentation. Here is a screenshot of the accuracy metrics, broken up by category. After further pattern recognition, these visualizations will reveal which categories each model scored better on.
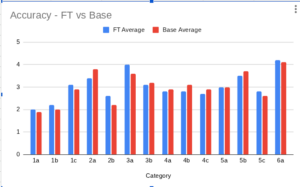
If you’ve been following my blog since the beginning of the evaluation process, you know that I also assessed instructional quality, not just accuracy. The results for this metric differed more than I expected, so I’d like to spend more time interpreting them. I plan to discuss these findings with my advisor and share what I learn in next week’s post.
We’re officially in the final stretch!!
Leave a Reply
You must be logged in to post a comment.