Week 9: Data!!
April 29, 2026
This week, I continued improving my hydration-monitoring experiment by removing the Saran Wrap covering and running a full set of tests on both gelatin hydrogels and real skin. My goal was not only to observe changes over time, but also to directly compare how a simulated model behaves versus actual human skin.
For the first part of the experiment, I used my standard gelatin mixture (1 tbsp gelatin to 1/4 cup water) with no covering at all. I placed my sensors in the same position as before and recorded humidity and temperature readings over several days. The results are shown in my first graph (gelatin over time). From this data, I observed a slight downward trend in humidity, which suggests that the gelatin was slowly losing moisture through evaporation. However, the change was still gradual and not large enough to consistently reach my dehydration threshold of 40% humidity. The temperature stayed close to room temperature, with minor fluctuations depending on the environment. Overall, this graph showed that removing the covering did improve my setup, but the gelatin still changes slowly compared to what I expected.

The second graph shows data collected from my skin (on my elbow) before and after exercise. This was part of my self-testing, since research suggests the elbow is a good region for detecting hydration-related signals. Unlike the gelatin, the skin data showed much more noticeable variation. After exercise, I saw a clear increase in humidity, likely due to sweating, and a slight increase in temperature. This created a much more dynamic pattern compared to the gelatin graph, with greater differences for us to see.
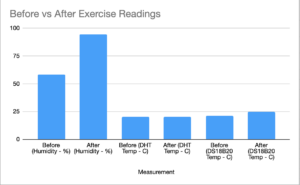
Comparing the two graphs really helped me understand the differences between my model and real conditions. The gelatin provides a controlled, slow-changing system, which is useful for observing gradual trends. However, real skin behaves in a much more responsive and dynamic way, especially when influenced by factors like movement and sweating. This explains why my humidity-based detection wasn’t working well at first—the changes I was trying to detect simply weren’t happening quickly enough in the gelatin alone.
Even though the gelatin experiment didn’t fully reach my expected thresholds, it still provided valuable insight. It confirmed that my sensors can detect small changes over time, while the self-testing showed that the system is capable of picking up larger, real-world fluctuations. Together, these two graphs give me a more complete understanding of how my device performs.
Moving forward, I plan to keep refining both testing methods. The gelatin will help me control variables and simulate long-term dehydration, while self-testing will allow me to observe real physiological responses. In my next blog, I will include a graph of my skin over time, as it will hopefully allow me to reach my lower threshold level for humidity. Combining both approaches will be key to improving the accuracy of my hydration-monitoring patch and making it more reliable in real-world use.
Reader Interactions
Comments
Leave a Reply
You must be logged in to post a comment.
Hi I really like your blog! Because your goal is to reach a threshold of 40% humidity on real skin, will you take consider ambient environmental humidity, or will your device require a baseline calibration reading when a new user wears it?