Week 10: Finishing up, part 2
May 12, 2025
Hi everyone! It was the final week of research for my project, and I can confidently say that this was a very hectic week. Due to a very tight deadline, I spent this week doing a lot, most of it centered around creating my poster.
Most of my week was spent working with the Jupyter Notebook, taking in the list of AR-linked TC events and using Tropycal, Cartopy, seaborn, and matplotlib to plot not only the chart below but also “subcharts” that looked at the general location of a tropical cyclone as it was feeding into an atmospheric river.
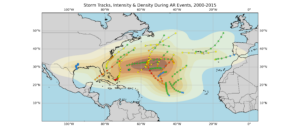
The main conclusion that can be drawn from this chart is that the general location of TCs during their AR-linked stage usually lies in the open Atlantic ocean. I experimented with different ways to present the data in a, well, presentable manner, and I ultimately settled on that chart. I plotted the category of the tropical system too according to the Saffir-Simpson Hurricane Wind scale too, with blue as tropical depression and red as category three (no higher category in this chart) but ultimately the overall category of the storm doesn’t really matter. One interesting case I can note from here is Hurricane Vince in 2005, which is the track that nears Portugal as a tropical depression. Moisture was being pulled from Vince in the form of an atmospheric river, and was impacting the Iberian Peninsula as such. As the AR moved towards the Mediterranean and Southern France, Vince also neared the Iberian Peninsula, bringing tropical impacts to the region as well.
After making some charts in Python, I then moved to analyzing the case study ERA5 data with Panoply. Initially, I thought that I would have to make a chart using Python, but I realized then that Panoply had a nice feature that would not require me to use Python. I looked at multiple variables and their charts, and after discussing with my External Advisor, I decided to chart four variables: IVT, 250mb wind, 700mb wind, and Mean Sea Level Pressure. After that process and analysis, I ended up with these charts (literally a screenshot from my poster):
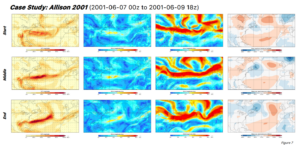
As you can see, I took three frames for each variable (left to right: IVT, 700mb wind, 250mb wind, MSLP), depicting the start, middle, and end of the AR event.
After the case study analysis, some more conclusions were drawn. Most significantly was that the alignment of the 250mb and 700mb jet stream helped pull moisture from the TC, and also the presence of an extratropical cyclone enhances this process and creates an AR. Though there are no truly concrete numbers that can characterize this, I did notice that the strength of the extratropical cyclone [ETC] required to create an AR from a TC moisture source depended on its distance from the TC itself. Evidently, ETC’s in closer proximity to the TC would not need to be as strong as one far from it.
Overall, the past ten weeks have been an extremely formative experience, and I’m so grateful to my internal and external advisors for their support. This project is only a stepping stone for a vast array of future research that I hope to do involving this subject. I hope to look at more variables surrounding the AR event that will allow me to zero in on the exact causes of this phenomenon. See you at the symposium!
Leave a Reply
You must be logged in to post a comment.