Week 7: A Week at NOAA's Center for Weather and Climate Prediction
April 12, 2025
Hi everyone and welcome back to my blog!
This week, I travelled to the other side of the country to work in-person with my External Advisor and his team in College Park, Maryland at the NOAA Center for Weather and Climate Prediction. I’m so incredibly thankful to Dr. Vijay Tallapragada (my EA) and his team (Dr. Murali, Dr. Keqin, and Dr. Xingren) for helping me on this project in person and giving me the opportunity to work at the CWCP office for a week.
I also met people across the NOAA’s National Center for Environmental Prediction and Environmental Modelling Center, including people who pioneered forecast model dynamics, development, and verification, including the creator of the United States Global Forecast System (US GFS) as well as the acting director of the NCEP himself. I genuinely never saw myself being in this position even only a year ago, and I’ve met so many new people and made so many new connections.
Okay, let’s talk about what I did this week. Last week, I viewed the IVT and AR maps with daily intervals. However, there’s a problem with that. You see, the other databases like HURDAT2, GDAS (or ERA5) reanalysis, et cetera, have 6-hour time intervals, in that data is recorded every 6 hours. As a result, I was forced to redo the entire process of creating the image plots, transferring them to my computer, and reanalyzing them. Rather than going the inefficient route of doing this on the terminal manually, I just modified an existing shell script to create the plots without me having to keep the computer open. 17 gigabytes later, I was able to pack all of these image files into a “tarball” (linux version of a zip file) to quickly (in this case 30 minutes is quick) transfer them to my computer, where I unpacked them. That seems like an easy process, but it’s the opposite. Packing the tarball itself was a faster process than what I was doing before, yet it still took over an hour due to the sheer amount of image files for each data variable. Then the transfer took about another hour. All of this was somehow still faster than what I did before (keep in mind, last time was daily intervals, this time was 6-hourly intervals).
Now that that was out of the way, I installed an application called IrfanView (basically a photo viewer app but better) that allowed me to quickly skip through the frames in the folder (meanwhile, windows photos was lagging the entire time), and I finally began the “last dance” of my analysis. To make things more efficient, I pulled up this monstrosity of a split screen (not depicting a TC-linked AR event per se, but it shows four active cyclones feeding into a moisture channel, including Hurricane Ike, which is pretty cool).

If it works, it works. No complaints. I’d show the results from the analysis if I hadn’t written them down instead of typed them. Basically I followed my previous methodology, this time for only six-hour intervals. In addition, I only looked at AR events that lasted at least 24 hours, such as from 00z UTC on September 19 to 00z UTC on September 20. The longer the duration, the better. So far, the longest TC-driven AR event that I have found was a 3-day, 12-hour long AR event that impacted northern France and the British Isles, driven by Tropical Storm/Hurricane Cristobal in August 2014.
For the sake of simplicity, I only “counted” an event in my logbook if there was a clear and active IVT channel from the source cyclone to the region being impacted (Europe). Here’s an example of the IVT chart for one frame during Cristobal’s AR:
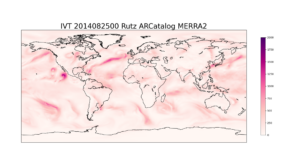
You can see the signature of an extratropical cyclone (look at the rotation) near the British Isles carrying all that atmospheric moisture from Tropical Storm Cristobal (which is near Cuba in this image). I’ve found that this setup exists for virtually every case of a TC-linked AR. The real question lies in how intense the extratropical cyclone needs to be to be able to channel all that moisture from thousands of miles away.
The intensity of the present extratropical cyclone (ExTC) is one of the variables I hope to look at. To do this, I will be using GDAS/ERA5 reanalysis data obtained from my external advisor. In addition to intensity, I will also look at things like the lower-level jet (wind at a 700 millibar pressure level) and precipitable moisture.
Right now, I’m still indecisive on what reanalysis dataset to use, but I’m leaning towards using ERA5 due to its simplicity of data retrieval. I’ll make this decision on Monday, though the analysis tools remain the same. Next week is spring break, and I’m still not sure if I want to work on this project next week, but I probably will. Until then, see you later!
Leave a Reply
You must be logged in to post a comment.